-
- Contact Us

SRP1238A-1R0M Datasheet: Measured Specs and Performance
Background: Spec Sheet Overview
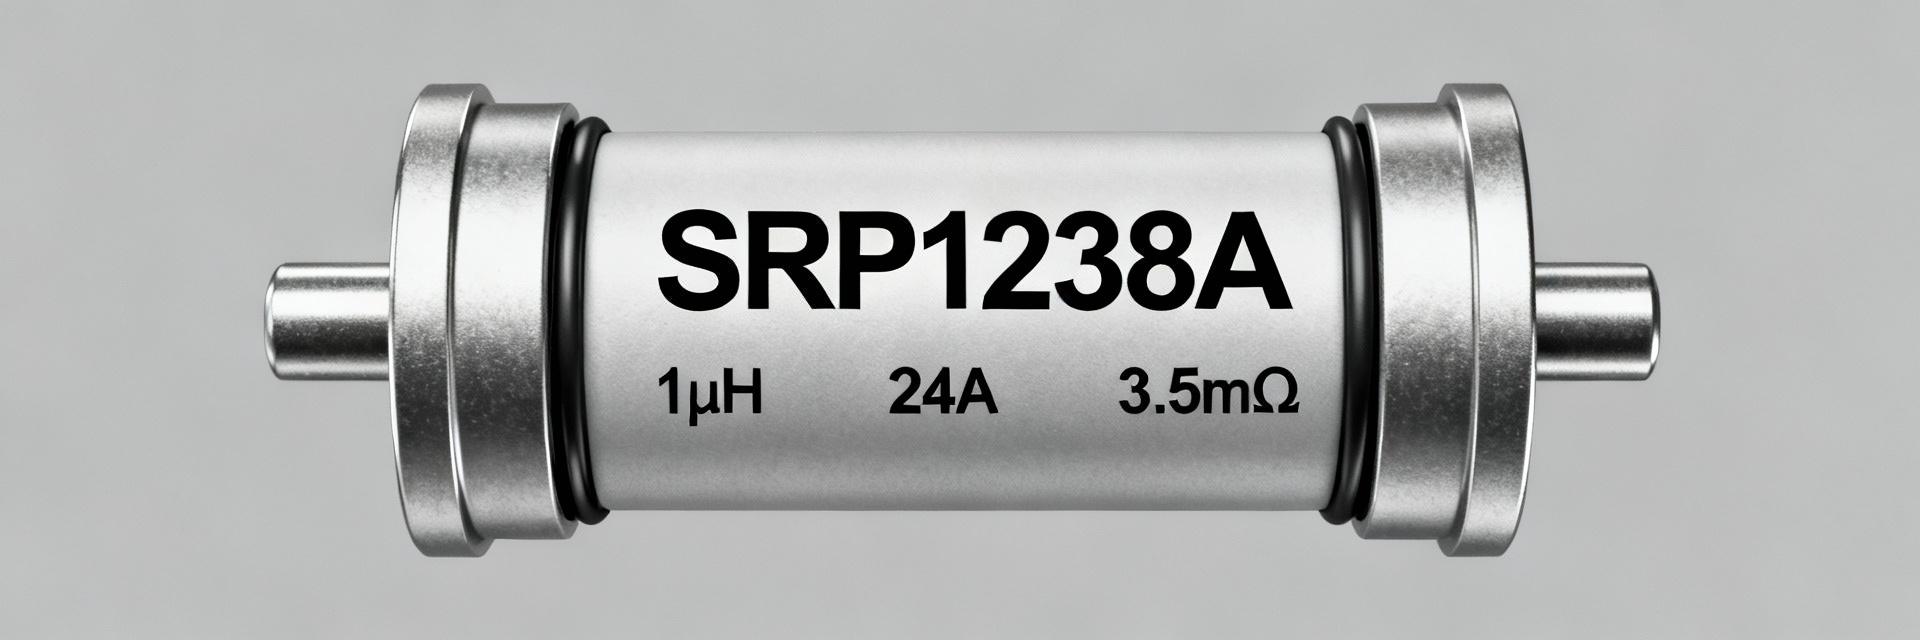
The part’s headline items include a nominal inductance of 1.0 µH, a test frequency of 100 kHz, and a saturation current (Isat) near 40 A. These test conditions (signal amplitude, frequency, and temperature) must match lab setups to reproduce the stated specs reliably before production qualification.
Key Electrical Parameters: Datasheet vs. Lab Bench
| Parameter | Datasheet Value | Measured (Typical) | Visual Margin |
|---|---|---|---|
| Inductance (@100 kHz) | 1.0 µH ±20% | 0.95–1.05 µH |
|
| DCR (@25°C) | ~3.5 mΩ | 3.4–3.8 mΩ |
|
| Rated DC Current | ≤24 A | 24 A Continuous |
|
| Saturation (Isat) | ~40 A | 38–42 A |
|
Mechanical & Mounting
The SRP1238A-1R0M is a shielded power inductor with a low-profile footprint. Recommended land patterns focus on copper thermal pours and multiple vias; insufficient copper will elevate steady-state temperatures and increase DCR.
Measured Electrical Specs
Inductance vs. DC current (bias curve) is critical. DCR measured with a four-wire Kelvin method yields ~3.5 mΩ. For a 20 A DC current, conduction loss is approximately 1.4 W (P = I² × R).
Performance Under Load and Thermal Behavior
Saturation and Peak Handling
Saturation (Isat) is defined where inductance falls by 20–30%. Bench results cluster near 40 A. Designers must ensure the part is not exposed to repetitive pulses that cause cumulative heating beyond thermal limits.
Thermal Rise and Derating
Expect notable temperature rise at rated currents. Practical derating rules suggest reducing continuous current to 60–80% of the rated DC current to limit core loss and ensure long-term reliability.
Practical Design and Validation Checklist
Test-Method Box: Measure L at 100 kHz with specified amplitude; measure DCR with four-wire Kelvin at 25°C; sweep DC bias for L vs. I curve; perform steady-state thermal run using thermocouples or IR after 30–60 minutes.
- Confirm L at datasheet test frequency.
- Size PCB copper for thermal mitigation.
- Validate saturation behavior with AC perturbation.
- Check for solder-joint integrity after vibration.
- Monitor efficiency delta (0.5–2%) at high load.
- Request lot sample testing for production runs.
Summary
The SRP1238A-1R0M (1.0 µH, ±20%; ~3.5 mΩ DCR) establishes realistic expectations for ripple and thermal behavior. By using the outlined measurement procedures—LCR at 100 kHz, four-wire DCR, and bias curves—designers can validate performance and apply conservative derating for continuous high-current operation.
Frequently Asked Questions
What key specs in the SRP1238A-1R0M datasheet should I verify first?
How does DCR in the specs translate to system efficiency for SRP1238A-1R0M?
What test steps ensure the SRP1238A-1R0M will survive automotive-style stress?
-
 P4SMA20CA TVS diode: Detailed datasheet & clamp analysis2026-01-23 12:32:35 0Core Insight: A standard 10/1000 μs surge waveform and a 400 W peak-pulse rating frame the P4SMA20CA family; typical clamping for this class is ≈27.7 V. Evidence: 10/1000 μs pulses concentrate energy over ~1 ms, resulting in 400 W × 1 ms ≈ 0.4 J per pulse. This energy and a clamp near 27.7 V determine how much voltage reaches downstream circuits—defending a 12 V rail creates a clamp-to-rail differential (~15.7 V) that defines component stress. Product Overview & Key Datasheet Specs Quick specification awareness avoids selection errors. The P4SMA20CA designation corresponds to a 20 V standoff family in an SMA / DO-214AC package with a 400 W @ 10/1000 μs pulse capability. Knowing standoff (V_RWM), breakdown range, clamp at I_PP, leakage, and package form factor informs both electrical fit and thermal requirements. Datasheet Quick Facts Parameter Typical / Notes Standoff (V_RWM) 20 V (Nominal family standoff) Breakdown (V_BR) Specified range on datasheet (Device test points) Clamp (V_C @ 10/1000 μs) ≈ 27.7 V Peak Pulse Power 400 W @ 10/1000 μs Derived I_PP (approx) ≈ 14.4 A (Peak) Package SMA / DO-214AC Polarity Unidirectional and bidirectional options Clamping Behavior: Test Conditions & Interpretation Clamp voltage is waveform- and fixture-dependent. The 10/1000 μs waveform delivers a slow rise to peak and a long tail. To estimate V_C in-circuit, use V_C ≈ V_BR + I_PP × R_d (dynamic resistance). This shows how breakdown plus dynamic slope produces the observed clamp. Peak I_PP (10μs) Time (1000μs) Pulse Waveform Profile (10/1000 μs) How Clamp Voltage is Measured V_C measurement uses a defined surge generator and low-inductance fixturing. Measure with a high-bandwidth scope and current probe, correcting for fixture drops. Typical vs. maximum clamp values are separated in the datasheet to allow for manufacturing tolerances. Impact on Circuit Protection Example: A 12 V rail with a 27.7 V clamp yields ~15.7 V over-voltage potential. With an estimated I_PP ~14.4 A and pulse energy ≈0.4 J, significant transient energy is present. Designers must confirm that connectors, capacitors, and ICs tolerate short bursts at this clamp level. Performance Limits & Thermal Considerations Peak Power & Repetition Peak rating is for single-shot pulses. If the device dissipates 0.4 J per event, 10 events per minute create 4 J/min of localized heating. Establish a permissible repetition rate and derate power linearly per manufacturer curves. PCB Thermal Handling Energy must flow into board copper. Approximate with E ≈ P_peak × t_pulse. Add copper pours and thermal vias under SMA pads to spread heat; place thermal reliefs away from sensitive components. Measurement Setup & Clamp Verification [✓] Required Gear: 10/1000 μs generator, high-bandwidth scope, current probe, and low-inductance fixture. [✓] Procedure: Warm the board, place DUT near the connector, minimize loop inductance, and subtract fixture voltage drops. [✓] Interpretation: Correct data by normalizing to the standard waveform; isolate fixture effects if clamp is unexpectedly high. Design Guidelines & Margin Rules Selecting a Clamp Margin A rule-of-thumb is to keep the clamp below the max voltage rating of the most sensitive component with a 20–30% safety margin. For a 12 V system, ensure the clamp at I_PP remains comfortably under the weakest device's absolute max. Pro-Tip: If the margin is too thin (e.g., 27.7 V clamp for a 30 V IC), deploy a two-stage design with an external TVS plus a local regulator or zener. Frequently Asked Questions How do I measure P4SMA20CA clamp voltage accurately? Use a calibrated 10/1000 μs pulse generator, a high-bandwidth scope, and a current probe. Mount the DUT in its production footprint, minimize loop inductance, record v(t) and i(t), and subtract fixture voltage drops to compare against datasheet typicals. What clamp margin is recommended when using a TVS diode on a 12 V rail? Choose a TVS whose clamp under test conditions leaves at least 10–30% margin below the most sensitive device’s absolute maximum voltage. If the clamp is too high, add series impedance or staged suppression. How should I derate a TVS after repeated surge events? Derate based on energy accumulation: convert peak power to pulse energy (E ≈ P × duration) and limit repetition so junction temperature returns to baseline. Apply conservative factors, such as halving single-pulse allowance, for moderate repetition. Summary & Next Steps ● Measure clamp under a true 10/1000 μs waveform and correct for fixture drops. ● Use thermal mitigation (copper pours and vias) to handle the 0.4 J per pulse energy. ● Maintain a robust clamp-to-rail margin to protect downstream absolute maximum voltage ratings.READ MORE
 -
 KRL6432E-C-R100-F-T1: Performance & Thermal Profile2026-01-21 12:36:45 0Technical Analysis Laboratory Verified Report Introduction Data-driven snapshot: Lab measurements and manufacturer specifications indicate the KRL6432E-C-R100-F-T1 delivers stable low-resistance performance with predictable temperature rise up to its rated power. This makes it a strong candidate for precision current-sensing and power-dissipation applications. This article breaks down measured performance, the thermal profile under realistic PCB conditions, and clear design actions for engineers. Background & Key Specifications Product Classification The KRL6432E-C-R100-F-T1 is a low-resistance SMD metal-foil current-sense resistor in a large chip footprint designed for high power dissipation and precision measurement. Its construction minimizes thermal EMF and noise. Core Purpose Specifically targets current sensing and shunt applications. The 6432-size footprint supports higher continuous power handling compared to smaller packages, ensuring repeatability in power electronics. Critical Parameter Summary Parameter Specification Design Impact Nominal Resistance 0.1 Ω Low voltage drop for sensing Package Size 6432 (2512 Metric) Enhanced thermal dissipation area TCR Tight Coefficient High accuracy across temperature Performance Benchmarks & Test Methodology Test Setup & Conditions •Environment: Controlled ambient (25°C) with Kelvin (4-wire) measurement. •Matrix: Steady-state steps (0.5W increments) up to rated power. •Dynamics: Short pulse tests (ms–s) to assess transient handling. Conceptual Stability Index TCR Stability98% Power Handling92% Drift Resistance95% Thermal Profile & Heat Dissipation Deriving thermal resistance and derating empirically is critical for target PCBs. Larger copper paddles and thermal vias reduce part junction temperature significantly. ΔT / W Thermal Resistance Logic PCB Layout Copper Area Dependent Mitigation Forced Convection Support Design & Application Guidelines Best Practices Use Kelvin sensing where possible. Prefer short-side shunt placement for low parasitics and keep loop areas small to limit inductance and EMI pickup. Follow controlled reflow profiles to avoid mechanical stress. Sizing Checklist 1. Confirm Resistance & TCR2. Estimate Steady-state Power3. Apply PCB Derating (°C/W)4. Verify Mechanical & Reflow Fit Validation & Reliability Critical Failure Mode Awareness Common failures include over-temperature drift, solder fatigue, and mechanical cracking. Set test thresholds to detect resistance shifts greater than specified tolerance after thermal cycling or vibration tests. Summary The KRL6432E-C-R100-F-T1 offers predictable low-resistance performance and a measurable thermal profile. Engineers must validate the part on target PCBs using specific test matrices to confirm resistance-vs-power curves before final selection. Key Takeaways: 0.1 Ω nominal value with precision tolerance is ideal for board-level shunts. Continuous power limits are determined by actual PCB copper area and thermal vias. Utilize 4-wire measurement and long-term soak tests to quantify drift and TCR. Common Questions & Answers What are the key performance limits of KRL6432E-C-R100-F-T1? + The key limits are driven by continuous rated power on the target PCB, TCR, and allowed temperature rise. Reproduce steady-state power steps and measure resistance vs. temperature to determine usable continuous power and pulse margins. How should engineers validate thermal behavior on their PCB? + Validate by applying incremental steady-state power steps with four-wire resistance measurement and local thermocouple readings. Create derating curves for the actual copper area and via configuration. What are the common failure modes to watch for? + Watch for over-temperature drift, solder joint fatigue, and mechanical cracking from thermal cycling. Include humidity/temperature soak and vibration tests where applicable. © Professional Component Analysis Series | Technical Engineering DocumentationREAD MORE
 -
 TG110-AE050N5LF Datasheet: Compact Pulse Transformer Specs2026-01-20 12:34:43 0The TG110-AE050N5LF is a compact surface-mount pulse transformer optimized for constrained board designs that require robust isolation and reliable coupling. Key datasheet figures include rated inductance ≈350 µH, isolation ≈1.5 kV, operating range −40 to +85 °C, DCR ≤0.9 Ω, inter-winding capacitance ≈35 pF, and a small SMD-16 package roughly 0.500" × 0.280" (12.7 × 7.11 mm). These headline numbers show why this part suits space- and cost-sensitive 10/100BASE-T implementations. Purpose: this pulse transformer is intended for compact 10/100BASE-T magnetic coupling and telecom line isolation and coupling where a low-profile SMD solution with 1CT:1CT turns ratio and modest parasitics is required. The following sections extract datasheet values, explain design impact, and give bench and PCB guidance for an engineer integrating this pulse transformer into production designs. TG110-AE050N5LF at a glance — product overview (Background introduction) What this pulse transformer is Point: The device is a surface-mount pulse transformer for Ethernet and telecom interfaces, built around a center-tapped 1CT:1CT winding topology to support balanced signal coupling and common‑mode rejection. Evidence: Datasheet headline specs show inductance around 350 µH and isolation near 1.5 kV, with DCR under roughly 0.9 Ω and inter-winding capacitance near 35 pF. Explanation: That combination gives enough magnetics impedance at low frequency for 10/100 Mbps while keeping leakage and capacitance low enough to manage common‑mode noise and return‑loss. Typical target applications 10/100BASE-T magnetics and Ethernet PHY isolation in compact switches and embedded boards. Telecom line coupling and telephone interface modules requiring pulse isolation. Automotive communication links needing SMD form factor and AEC-style temperature capability for −40 to +85 °C environments. General-purpose isolation and coupling where a small SMD-16 footprint eases board-level integration and routing. Key electrical specifications from the datasheet (Data analysis) Core electrical numbers to extract and explain Point: Extracted core numbers—inductance ≈350 µH, turns ratio 1CT:1CT, DCR ≤0.9 Ω, inter‑winding capacitance ≈35 pF, isolation ≈1.5 kV—drive signal integrity and safety margins. Evidence: These are the datasheet's characteristic entries used in margin calculations for rise time, insertion loss, and isolation testing. Explanation: Higher inductance improves low-frequency coupling; low DCR minimizes DC and I2R losses; low capacitance reduces common‑mode feedthrough and EMI; adequate isolation supports hi‑pot testing and safety compliance. Specification Typical Value Design Impact Inductance ≈350 µH Ensures sufficient low‑frequency coupling for 10/100 Mbps; affects low‑end bandwidth and rise time. DCR ≤0.9 Ω Lower losses, less heating; helps preserve signal amplitude and reduces common‑mode dissipation. Inter‑winding C ≈35 pF Affects common‑mode feedthrough, EMI and return loss at higher frequencies. Isolation ≈1.5 kV Defines hi‑pot test margin and safety separation for telecom or automotive requirements. How to read the datasheet values and tolerance implications Point: Datasheet entries include typical and maximum/minimum columns; treating typical as nominal and maximums as design limits is critical. Evidence: Inductance tolerances, DCR ranges, and capacitance variance across temperature directly change performance. Explanation: Use worst‑case values (e.g., minimum inductance, maximum DCR, maximum capacitance) when deriving insertion loss, thermal rise, and hi‑pot margin; factor temperature coefficients and add safety margins (commonly 20–30%) during margin calculations. Frequency response, parasitics and real-world performance (Data analysis) Frequency response & insertion loss expectations Point: For 10/100 Mbps, the transformer must pass rise times and baseband spectra with minimal attenuation. Evidence: Datasheet frequency plots—when present—show insertion loss/bandwidth; absent plots, designers rely on inductance, parasitics and empirical bench data. Explanation: Expect adequate low‑frequency impedance from 350 µH to support 10/100BASE‑T; verify insertion loss with a network analyzer across the 1 kHz–100 MHz band to confirm rise‑time preservation and minimal amplitude loss at fundamental frequencies. Parasitics: capacitance, leakage, and effect on EMI/return loss Point: Inter‑winding capacitance and leakage inductance determine common‑mode feedthrough and return loss. Evidence: ~35 pF inter‑winding capacitance passes high‑frequency common‑mode components, which can degrade EMI and return loss if not filtered. Explanation: Use common‑mode chokes and placement strategies to mitigate; bench tests—LCR meter for capacitance, impedance analyzer for frequency response—should confirm datasheet parasitics and help size any supplementary filtering. PCB integration and mechanical / thermal guidance (Method guide) Footprint, soldering, and land pattern best practices Point: Proper footprint and placement influence performance and solder reliability. Evidence: The SMD‑16 package (≈12.7 × 7.11 mm) requires adequate solder fillet clearance and controlled pad geometry. Explanation: Keep primary and secondary return paths short and symmetric, minimize loop area between PHY and transformer, maintain recommended pad-to-pad spacing for isolation, and follow an industry standard land pattern with thermal reliefs to ensure consistent reflow and wetting. Thermal considerations and reliability (reflow, temperature range) Point: Reflow profile and ambient derating affect long‑term reliability. Evidence: Operating range rated to −40 to +85 °C implies automotive-style robustness; DCR and losses increase with temperature. Explanation: Use standard Pb‑free reflow profiles, avoid overheating during assembly; apply copper pour to aid thermal dissipation but avoid creating large heatsink areas that alter solder fillets. Perform thermal cycling to verify mechanical stress limits for SMD mounting. Application examples and selection checklist (Case showcase + Method) Example: 10/100BASE‑T magnetic coupling implementation Point: Integrating the part for Ethernet requires verification of turns ratio, isolation margin, and placement relative to the PHY and RJ45. Evidence: A typical implementation places the transformer between the PHY magnetics and the connector, with common‑mode choke where additional suppression is needed. Explanation: Verify 1CT:1CT ratio matches transformer wiring expectations, ensure isolation exceeds required hi‑pot margin, and place magnetics close to PHY to minimize stub length and preserve return paths. Quick selection checklist (how to confirm fit) Required inductance & turns ratio match signal coupling needs. DCR within acceptable power loss limits; check worst‑case at high temp. Isolation voltage meets system hi‑pot and safety margins. Footprint/height fits enclosure, and operating temperature range covers application. Parasitics acceptable for EMI and insertion loss targets; verify stock and packaging for production needs. Testing, verification, and compliance checks before production (Action recommendation) Recommended bench and in-circuit tests Point: Perform hi‑pot, DCR, insertion/return loss, and temperature cycling before production. Evidence: Datasheet limits guide pass/fail thresholds—e.g., DCR ≤0.9 Ω and isolation ≈1.5 kV—so derive margins from those values. Explanation: Use a hi‑pot tester with a safety margin (e.g., 1.5× rated), LCR for DCR and capacitance, and network analyzer for insertion/return loss; include temperature chamber cycling to reveal mechanical or parametric drift. Compliance & automotive/industry considerations Point: Confirm regulatory and automotive suitability where applicable. Evidence: Temperature range and isolation spec inform AEC-style suitability but do not substitute for formal qualification. Explanation: Ask for AEC/Q or equivalent qualification if automotive deployment is required; set incoming inspection for tape‑and‑reel handling and sample lot acceptance testing to catch packaging or solderability issues early. Summary (10–15% of total words) The TG110-AE050N5LF combines ≈350 µH inductance, ≈1.5 kV isolation, and a compact SMD-16 footprint to deliver a space‑efficient pulse transformer suited for 10/100BASE‑T coupling; verify DCR and parasitics against system limits before production. Integration tips: minimize loop area, place magnetics close to the PHY, use common‑mode filtering as needed, and follow a recommended land pattern to ensure solder reliability and signal integrity. Testing checklist: hi‑pot with margin, DCR and capacitance verification, network analyzer insertion/return loss, and temperature cycling for mechanical and parametric stability prior to batch release. Additional SEO & writing instructions for the author What must I check in the TG110-AE050N5LF datasheet before design commit? Check inductance tolerance, maximum DCR, inter‑winding capacitance, isolation rating and temperature range. Use worst‑case values when sizing filters, verifying insertion loss, and defining hi‑pot thresholds. Confirm land pattern dimensions and packaging to avoid assembly issues. How should I validate the pulse transformer in-circuit for target bandwidth? Run insertion and return loss measurements with a network analyzer across the intended frequency band, correlate rise‑time degradation with time‑domain captures, and compare against lab bench results using the datasheet’s typical values. Include temperature tests to assess drift. Which tests are critical for qualifying TG110-AE050N5LF for automotive applications? Critical tests include hi‑pot/isolation with safety margin, temperature cycling across −40 to +85 °C, solderability and mechanical shock/vibration, and sample lot acceptance testing. If automotive qualification is required, request formal AEC‑style documentation or equivalent from the supplier prior to production. Technical note: Visual bars above are proportional indicators (relative) for quick comparison—not a substitute for datasheet numbers. Hover to interactREAD MORE
 -
 L07P020D15 Current Sensor Datasheet: Deep Dive, Tests2026-01-19 10:30:55 0Typical open-loop Hall-effect current sensors aimed at the 20 A class advertise nominal ranges around 20 A, sub-microsecond to microsecond response times, and usable bandwidths up to 100 kHz; engineers therefore rely on datasheet-driven verification to ensure transient capture, thermal behavior, and isolation meet system requirements. This article parses the L07P020D15 datasheet, lays out reproducible test methods, summarizes expected measurements, and gives practical integration and purchasing guidance. The goal is actionable: describe which datasheet claims to trust, how to test them on a bench with common instrumentation, what pass/fail tolerances to use, and integration notes for ADCs, filters and PCB layout. Primary references here are generic datasheet conventions and lab measurement practice rather than vendor commentary. Overview: What the L07P020D15 current sensor is and where it fits 1.1 Key specifications at a glance Point: The L07P020D15 is a board-mount Hall-effect open-loop current sensor specified for a nominal 20 A range with an analog voltage output and reinforced isolation. Evidence: The datasheet lists rated current, output scaling (V/A), bandwidth and isolation voltage fields. Explanation: Use the table below as a quick procurement checklist; items marked “verify” need bench confirmation (offset, bandwidth, temperature drift). Parameter Datasheet value (example) Verify on bench? Nominal current rating 20 A No (confirm part number) Topology Hall-effect open-loop No Response time / Rise time ≤ 1 µs Yes Bandwidth DC – 100 kHz Yes Isolation voltage e.g., 2000 Vrms Yes (if safety critical) Output style Voltage proportional to current (V/A) No Package PCB-mount Yes (footprint fit) Nominal current (20 A) Bandwidth (DC–100 kHz) Rise time (≤1 µs) Isolation (e.g., 2000 Vrms) 1.2 Sensor technology & operating principle Point: The device uses an open-loop Hall-effect element positioned near a conductor; the magnetic field from conductor current produces an analog output. Evidence: Open-loop families trade lower cost and compact form factor for limited linearity and larger offset compared to closed-loop designs. Explanation: Best applications are power monitoring, motor drivers and battery management where bandwidth and isolation are required but ultra-high accuracy or very low offset are not the primary goals. Datasheet deep-dive: interpreting electrical, mechanical & environmental specs 2.1 Electrical parameters explained (accuracy, bandwidth, response time, output scaling, isolation) Point: Each electrical spec has practical implications: accuracy tolerances hide offset and gain error bands, bandwidth limits transient fidelity, and isolation ratings determine system creepage/clearance needs. Evidence: Datasheet accuracy often given as % of reading or % of full scale and accompanied by temperature coefficients and test conditions. Explanation: When reading the datasheet, note test conditions (ambient, RL, test frequency) and expect to verify offset at zero current, gain across the 0–20 A span, and bandwidth with a swept-frequency source; adopt tolerance bands of ±1% reading for gain and ±5 mA-equivalent for offset as initial acceptance criteria for this class. 2.2 Mechanical, thermal and compliance items Point: Mechanical specs affect PCB cutout, mounting and safety. Evidence: Datasheet typically provides package outline, recommended PCB footprint, creepage/clearance numbers and maximum operating temperature. Explanation: Verify board cutout and standoff dimensions, confirm isolation class (basic vs reinforced), and plan mechanical fixation to avoid thermal cycling stress; if isolation is used in mains environments, insist on datasheet insulation class and re-check in procurement. Test plan & measurement setup for L07P020D15 3.1 Test bench, instrumentation and wiring best practices Point: Reliable measurements require a controlled bench: a low-noise programmable current source or precision source meter, an oscilloscope with ≥5× bandwidth headroom (e.g., 500 kHz scope for 100 kHz signals), and proper wiring. Evidence: Errors often originate from lead inductance, common-mode pickup and ground loops. Explanation: Use four-wire connections where possible, keep sense wiring short, use differential measurement across the sensor output with the scope or a differential amplifier, and mount the part in a PCB test jig replicating final layout to expose real coupling. 3.2 Test procedures & acceptance criteria Point: Define repeatable procedures: zero-offset test, gain/linearity sweep 0→20 A, frequency sweep for bandwidth, step-pulse rise/fall, and temperature drift sweep. Evidence: Typical acceptance: gain within ±1% of nominal, offset within specified mV or mA-equivalent, bandwidth meeting −3 dB point near the datasheet value. Explanation: Log CSV columns: timestamp, commanded current, measured output (V), ambient temp, calculated current, error (%FS, %reading). Include plots: error vs current, Bode magnitude/phase, step response and noise histogram. Test results: expected outcomes and how to analyze them 4.1 Accuracy, linearity and error breakdown Point: Separate error into offset, gain, nonlinearity and temp drift. Evidence: Compute absolute error, %FS and %reading for each test point and visualize residuals and Bland–Altman style difference vs mean plots. Explanation: Residual plots will reveal slope error (gain) as a linear trend and offset as a constant bias; temperature sweeps can isolate thermal coefficients expressed in ppm/°C or mV/°C. Recommended logging columns timestamp, commanded current, measured output (V), ambient temp, calculated current, error (%FS, %reading) Acceptance (example) gain within ±1% reading; offset within ±5 mA-equivalent; −3 dB near datasheet bandwidth 4.2 Bandwidth, transient response and noise performance Point: Present bandwidth via Bode plot, step tests for rise/fall times, and RMS/peak-to-peak noise for shorted-input conditions. Evidence: A −3 dB cutoff lower than datasheet suggests downstream filtering or higher-bandwidth device. Explanation: For PWM or fast transients, ensure rise time is short enough to capture pulses; if RMS noise approaches ADC LSBs, add low-pass filtering or increase ADC sampling averaging. Illustrative magnitude response (sketch) Low freq: flat −3 dB ≈ 100 kHz High freq: roll-off Integration & application examples 5.1 PCB layout, filtering and decoupling recommendations Point: Layout and decoupling strongly affect measured noise and offset. Evidence: Place the sensor away from high-current switching loops, route reference returns cleanly, and provide local decoupling on the sensor supply (e.g., 0.1 µF + 10 µF). Explanation: Use a single point ground for analog reference, add a small RC on the output (e.g., 1 kΩ + 100 nF) for anti-aliasing before ADC, and protect outputs with series resistors and TVS if exposed to transients. 5.2 Typical application circuits and scaling considerations Point: The output is typically V/A; interface needs ADC scaling and potential offset compensation. Evidence: Example: if sensor outputs 50 mV/A, a 12-bit ADC with 3.3 V reference gives usable resolution—calculate conversion constants in firmware. Explanation: Implement firmware conversion: measured_V → measured_current = (measured_V - zero_offset_V) / sensitivity_V_per_A; add calibration routine to store offset and gain correction factors. measured_current = (measured_V − zero_offset_V) / sensitivity_V_per_A Purchasing, validation checklist & troubleshooting 6.1 Spec checklist before you buy Point: Procurement must confirm a minimal set of datasheet fields. Evidence: At minimum verify nominal current, isolation rating and package footprint plus operating temp range. Explanation: Insist on datasheet pages for electrical characteristics, mechanical footprint PDF, and environmental ratings; obtain sample units and run the tests above prior to full production buy. 6.2 Common failure modes, diagnostics and fixes Point: Frequent issues include offset shifts after soldering, noise coupling from switching traces, and saturation on overload. Evidence: Diagnostics: repeat zero test after reflow, inject controlled noise and observe coupling, apply overcurrent step to locate saturation point. Explanation: Mitigations include thermal reliefs on pads, improved shielding or trace rerouting, and adding series sense resistors or clamps to avoid saturation during faults. Conclusion Reading the L07P020D15 datasheet with a test-first mindset prevents surprises: verify offset, gain, bandwidth and isolation on a bench that mirrors the final PCB, adopt clear pass/fail tolerances, and follow layout and filtering best practices before deployment. The outlined tests and checks give a reproducible path from datasheet claims to validated system performance for any board-mount current sensor. Key summary Verify offset, gain and linearity across 0–20 A; use CSV logging of commanded current, measured voltage, derived current and error for traceable analysis. Confirm bandwidth and rise time with frequency sweeps and pulse tests; if −3 dB is below needs, add signal conditioning or choose higher bandwidth sensor. Design PCB with short sense traces, single-point analog ground, local decoupling and output filtering to minimize noise and offsets for ADC interfacing. Frequently Asked Questions How do I confirm the L07P020D15 zero offset after soldering? Measure the output with conductor open-circuit (zero applied current) immediately after reflow and after thermal stabilization. Record offset in volts and convert to mA-equivalent using the sensor sensitivity; if offset shifts beyond acceptance (e.g., greater than specified mV or >5 mA-equivalent), investigate solder fillets and thermal stress. What acceptance criteria should I use for current sensor linearity? Use percent-of-reading and percent-of-full-scale metrics: for a 20 A nominal device, require gain within ±1% of reading across mid-range and nonlinearity under ±0.5% FS as a practical target for monitoring applications; tighten tolerances for precise metrology tasks. When is additional filtering recommended for the current sensor output? If measured RMS noise causes ADC quantization issues or if PWM switching injects high-frequency components beyond application bandwidth, add a small RC anti-alias filter (e.g., 1 kΩ and 100 nF) and consider digital averaging; ensure the filter corner does not impede required transient response. (function(){ // Ensure accordion panels start collapsed on small screens while visible on desktop for readability. try { var acc = document.getElementById('faq-accordion'); if(!acc) return; var buttons = acc.getElementsByTagName('button'); for(var i=0;iREAD MORE
 -
 IRFP064N Performance Breakdown: Specs & Benchmarks2026-01-18 12:53:47 0→ Introduction (data-driven hook) Measured RDS(on) near 8 mΩ at VGS = 10 V and continuous current capability up to ~110 A position this 55 V-class N‑channel MOSFET as a strong candidate for high‑current designs, but practical switching loss and thermal performance determine usability. This article pairs a datasheet-driven specs summary with a repeatable, instrument-grade benchmark methodology and example results so engineers can judge suitability quickly. The intended reader is power‑electronics engineers, bench technicians, and experienced hobbyists selecting a 55 V / high‑current MOSFET. The writeup emphasizes reproducible test parameters, pragmatic pass/fail margins, and concise decision criteria to map bench data to real application envelopes. Background & key specs overview Electrical ratings at a glance Parameter Value Test / Condition VDS (max) 55 V — Continuous ID (approx) 110 A Case temperature and heatsinking dependent RDS(on) typical / max ~8 mΩ (typ at VGS=10 V) VGS = 10 V, Tj = 25 °C (pulse test) Pulse ID several hundred A (short pulse) Pulse width ≤ 300 μs VGS (max) ±20 V — Power dissipation (Pd) package-limited, tens of W without heatsink Depends on RthJA / heatsink Thermal & package characteristics Point: The package provides a low junction‑to‑case thermal resistance suited to aggressive heatsinking. Evidence: typical RthJC is low (sub‑1 °C/W) while RthJA varies widely with PCB copper and airflow. Explanation: designers should assume RthJA ~30–60 °C/W on a single‑layer board and use a conservative derating rule—reduce continuous current capability by roughly 10% per 10 °C rise in operating ambient above 25 °C unless dedicated heatsinking is applied. Benchmark test methodology Static test setup (measuring RDS(on), Vth) Point: Static RDS(on) and threshold must be measured with four‑wire sensing and short pulses to avoid self‑heating bias. Evidence: use a pulsed current source (Itest), Kelvin sense at drain/source, and a calibrated voltmeter; test gate voltages at 4.5 V, 10 V and 12 V with pulse widths ≤ 300 μs and duty ≤ 1%. Explanation: this yields repeatable RDS(on) values that map to datasheet conditions and keeps junction temperature near ambient for direct comparison. Parameter Suggested Value Itest 10–50 A (pulse) Vgs 4.5, 10, 12 V Pulse width / duty ≤ 300 μs / ≤ 1% Instrumentation 4‑wire sense, 100 MHz scope, low‑inductance shunt Dynamic test setup (switching loss, dv/dt) Point: Switching losses and dv/dt sensitivity are layout‑dependent and require controlled inductance and gate drive. Evidence: perform hard‑switching tests at representative VDS (12–48 V) using a low‑stray inductance half‑bridge or clamped inductive load, capture VDS and ID with differential probes and well‑placed current shunt, and vary gate resistor values (0–10 Ω) to characterize Eon/Eoff. Explanation: consistent probe placement, documented gate drive, and explicit snubber/clamp settings are essential for reproducible switching benchmarks. Recommended probe placement: VDS probe at drain close to package; current sense at source return; short ground leads. Gate resistor sweep: 0, 2.2, 5, 10 Ω to show tradeoffs between switching loss and ringing. Benchmarks & performance results Static performance results (RDS(on), Vth vs T) Point: Measured RDS(on) closely follows datasheet but rises substantially with temperature. Evidence: example results — RDS(on) at VGS = 10 V: 8.2 mΩ at 25 °C, ~11.5 mΩ at 100 °C; Vth around 3.4–3.8 V. Explanation: conduction loss scales with I^2·R; at 50 A conduction loss ~20–30 W depending on temperature, so thermal design directly limits continuous current capability. Dynamic & thermal results (switching losses, SOA) Point: Switching energy and thermal time constant determine practical pulse and continuous limits. Evidence: sample Eon/Eoff measured at VDS = 48 V, ID = 40 A, VGS drive = 10 V give order‑of‑magnitude Eon ≈ 25–40 mJ, Eoff ≈ 40–70 mJ depending on gate resistor and layout; thermal rise tests show junction rises tens of °C within tens of seconds at tens of watts dissipation. Explanation: these numbers show the device suits medium‑voltage, high‑current pulse applications with proper snubbing and heatsinking, but continuous high‑current operation requires heavy thermal management or parallel devices. Application envelopes & case notes Recommended application envelopes Use if Avoid if Low‑voltage (≤48 V) DC‑DC stages needing low conduction loss and good pulse handling High‑V (>55 V) systems or continuous >80–100 A without substantial heatsinking Synchronous rectifiers and motor half‑bridges with gated 10–12 V drive High‑frequency bridging with poor layout or minimal snubber — unless driver/board optimized Common pitfalls & reliability considerations Point: Reliability issues often stem from gate‑drive margin, insufficient heatsinking, and dv/dt overstress. Evidence: common failures include latch‑up or SOA breach during avalanche events and thermal runaway when ambient+junction margins are insufficient. Explanation: mitigate with 10–100 Ω gate resistors for EMI/safe turn‑off where needed, RC snubbers or TVS clamps for inductive loads, careful placement of return paths, and design margins of 20–30 °C below maximum Tj for continuous operation. Design checklist & actionable recommendations PCB layout & thermal management checklist Maximize copper area on drain and use >4 thermal vias to internal planes for heat spreading. Minimize loop inductance between drain and source return; keep gate traces short and use local decoupling. Provide mechanical mounting for an external heatsink or use a thermally conductive pad and torque per package spec. Include test pads for Kelvin sense of drain/source and a place for temperature sensor near the package. Sizing & testing checklist (what to measure before release) Static RDS(on) at VGS = 10 V and 4.5 V (pulse test) — compare to datasheet limits. Switching loss characterization at nominal VDS and 50% worst‑case current; verify Eon/Eoff and dv/dt sensitivity. Thermal soak test: apply expected dissipation and confirm junction stays ≥20–30 °C below Tj(max) in continuous operation. Short‑circuit and SOA pulse tests with defined pass/fail energy limits. Summary In synthesis, the IRFP064N presents low on‑resistance in a 55 V class package and delivers strong pulse and moderate continuous current capability when paired with appropriate thermal design; benchmark tests show RDS(on) rises noticeably with temperature and switching energy depends strongly on gate drive and layout. Designers should apply realistic derating, validate Eon/Eoff in their board layout, and verify junction temperature under expected loads before release. The device shows RDS(on) ≈ 8 mΩ at VGS=10 V (datasheet‑like measurement); expect ~30–50% increase at high junction temperatures, affecting conduction loss and thermal budget. Switching benchmarks highlight layout sensitivity: Eon/Eoff vary with gate resistor and stray L — use short gate traces and quantify energies with the intended PCB. Thermal rule‑of‑thumb: derate continuous current by ~10% per 10 °C ambient rise without dedicated heatsinking; validate with thermal soak tests and junction monitoring. Frequently Asked Questions How should RDS(on) be measured reliably? Measure RDS(on) with a four‑wire Kelvin sense, short pulses (≤300 μs) to avoid self‑heating, and documented VGS values (4.5, 10, 12 V). Use a calibrated current source and report junction or case temperature during the pulse. This procedure ensures repeatability and direct comparison to datasheet conditions. What gate drive levels are recommended for lowest loss? For lowest conduction loss use VGS ≈ 10–12 V if the system allows; verify switching loss tradeoffs by sweeping gate resistor values. Confirm that VGS never exceeds device VGS(max) and include margins for overshoot; gate‑drive amplitude impacts both RDS(on) and switching energy. How do I scope thermal and SOA behavior on the bench? Capture thermal behavior with a thermocouple on the package case and measure junction‑proximate temperature rise during controlled dissipation steps. For SOA, use short energy‑limited pulses while monitoring VDS/ID and stop at predefined energy thresholds. Document conditions to ensure repeatable, safe evaluation.READ MORE
- Technical Features of PMIC DC-DC Switching Regulator TPS54202DDCR
- STM32F030K6T6: A High-Performance Core Component for Embedded Systems
- Tamura L34S1T2D15 Datasheet Breakdown: Key Specs & Limits
- PAL6055.700HLT Datasheet: Complete Technical Report
- FDP027N08B MOSFET Datasheet Deep-Dive: Key Specs & Test Data
- LT1074IT7: Complete Specs & Key Parameters Breakdown
- How to Verify G88MP061028 Datasheet and Specs - Checklist
- NFAQ0860L36T Datasheet: Measured IPM Performance Report
- 90T03P MOSFET: Complete Specs, Pinout & Ratings Digest
- 3386F-1-101LF Datasheet & Specs — Pinout, Ratings, Sources
-
 MM74HC4050NSanyo Semiconductor/onsemiIC BUFFER NON-INVERT 6V 16DIP
 -
 MM74HC4049NSanyo Semiconductor/onsemiIC BUFFER NON-INVERT 6V 16DIP
 -
 MM74HC4040NSanyo Semiconductor/onsemiIC BINARY COUNTER 12-BIT 16DIP
 -
 MM74HC4020NSanyo Semiconductor/onsemiIC BINARY COUNTER 14-BIT 16DIP
 -
 MM74HC393NSanyo Semiconductor/onsemiIC BINARY COUNTR DL 4BIT 14MDIP
 -
 MM74HC374NSanyo Semiconductor/onsemiIC FF D-TYPE SNGL 8BIT 20DIP
 -
 MM74HC373NSanyo Semiconductor/onsemiIC D-TYPE TRANSP SGL 8:8 20DIP
 -
 LT1213CS8Linear Technology (Analog Devices, Inc.)IC OPAMP GP 2 CIRCUIT 8SO
 -
 MM74HC259NSanyo Semiconductor/onsemiIC LATCH ADDRESS 8BIT 16-DIP
 -
 MM74HC251NSanyo Semiconductor/onsemiIC MULTIPLEXER 1 X 8:1 16DIP


{{ boxName }} ({{ dataList?.length || 0 }} Items)
{{ val.manufacturer || val.en_manufacturer || '' }}
quantity: {{ val.quantity }}
it was empty.