lang.lang_save_cost_and_time
Help you save costs and time.
lang.lang_RPFYG
Provide reliable packaging for your goods.
lang.lang_fast_RDTST
Fast and reliable delivery to save time.
lang.lang_QPASS
High quality after-sales service.
blog
17 November 2025
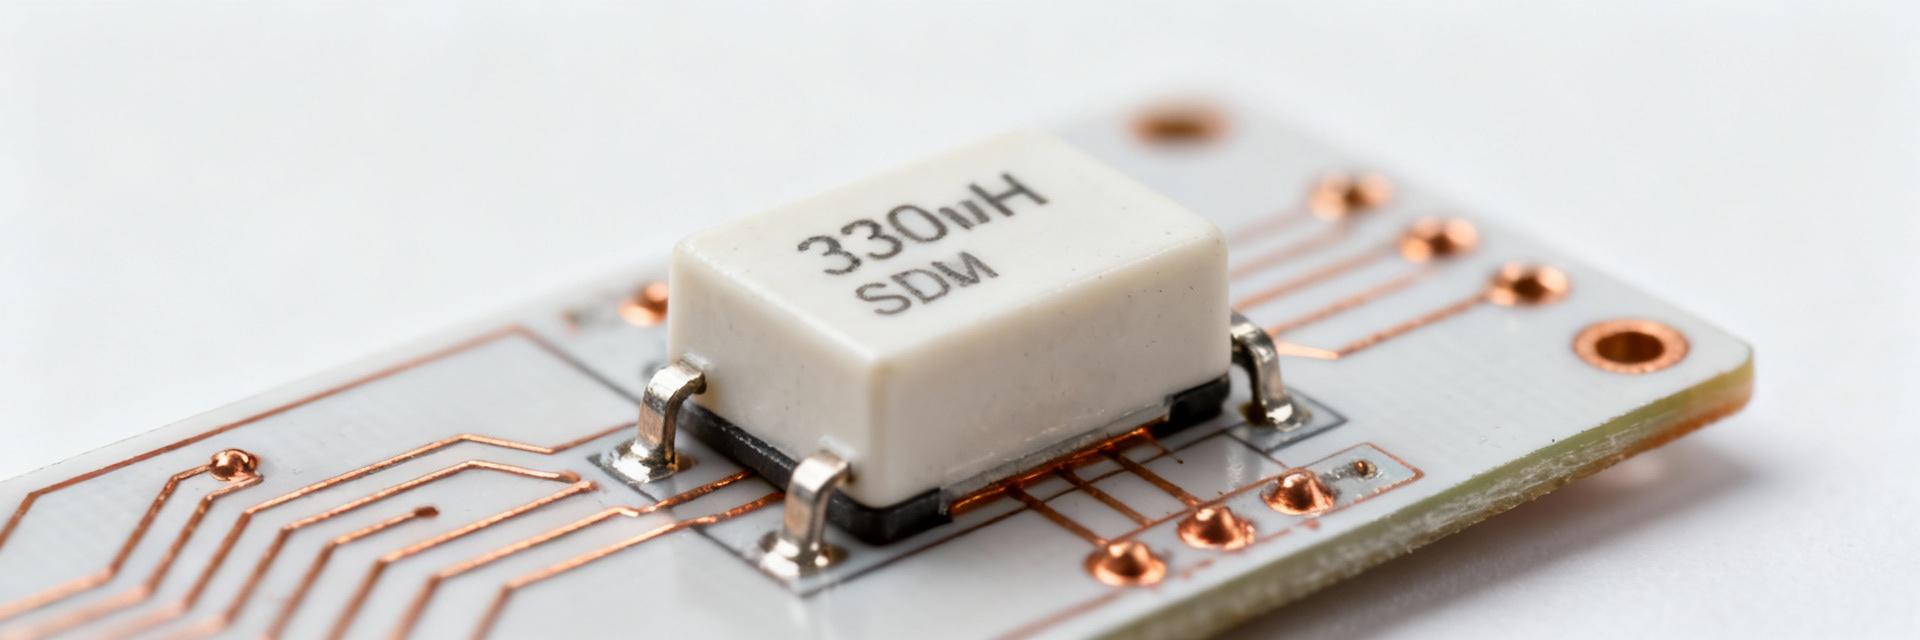
The LT1074 family has been a long-standing choice for multi-amp bipolar switching regulator designs in industrial and legacy power rails, typically operating near 100 kHz and deployed where robustness and simple thermal management matter. This article provides a focused breakdown of the LT1074IT7: key points extracted from the official datasheet, how to interpret the electrical specs, practical layout and component-selection guidance, example circuits, and a hands-on implementation checklist. Expect references to datasheet tables and device specs where precision is required. All guidance below is grounded in the manufacturer’s published device tables and field-proven design practice; where numerical precision is critical the reader should verify values against the official datasheet and the latest device revision. 1 — Overview: LT1074IT7 & Family Context (background) Part identity & common variants Point: The LT1074 series is a legacy bipolar switching regulator family; the LT1074IT7 is a specific suffixed part used in power designs requiring several amps of output current. Evidence: Manufacturer documentation distinguishes LT1074 family parts (fixed and adjustable versions) and the related LT1076 device family which targets different pinouts and performance trade-offs. Explanation: The suffix (for example IT7 or PBF in distributor records) typically encodes package type, temperature grade, and lead finish—common packaging includes TO-220-7 style packages (often referenced as PZFM7/TO-220 variants) which are favored for board-attach heatsinking. Link: Consult the official product page and the datasheet for the full list of SKUs and distributor catalog references to confirm exact ordering codes and temperature grades. Typical application space & strengths Point: The family is used for single-output step-down converters serving 5 A and higher loads in industrial and legacy systems. Evidence: Application notes and reference circuits historically show the LT1074 used for motor-control rails, industrial logic supplies, and intermediate DC rails where a bipolar process switch offers rugged current handling and predictable current-limited behavior. Explanation: Designers choose this family for predictable current limiting, straightforward external component choices, and the ability to use conservative switching frequency (~100 kHz) to balance inductor size versus efficiency; the bipolar switch device also provides a particular safe-operating-area characteristic useful in harsh environments. Key calling specs at a glance (one-line summary) Point: Key parameters to check immediately are input voltage range, peak switch current rating, nominal switching frequency, typical efficiency band, and pinout. Evidence: The datasheet tables list these parameters under “Absolute Maximums,” “Recommended Operating Conditions,” and “Electrical Characteristics” and should be consulted for design limits. Explanation: As a snapshot, expect an industrial VIN range compatible with unregulated 12–30 V rails (verify for the chosen variant), a peak switch current sufficient for 5 A continuous outputs with margin, a nominal switching frequency near 100 kHz, and typical full-load efficiencies in the 70–85% range depending on VIN/VOUT and external component choices. Note: full numeric values and pin assignments must be taken from the official datasheet table for final design. 2 — LT1074IT7 Complete Specs & Electrical Parameters (data analysis) Absolute maximums & recommended operating conditions Point: Understanding absolute maximums versus recommended operating conditions is essential to avoid latent failures. Evidence: The datasheet separates non‑reversible stress limits (absolute maximums) from recommended operating conditions and provides temperature- and voltage-related derating guidance. Explanation: Designers must treat absolute maximum ratings (e.g., maximum VIN, maximum VSW, maximum junction temperature) as limits never to be exceeded even briefly. Recommended operating conditions define the safe design envelope where guaranteed electrical characteristics apply; designs should include margin (typical derating of 10–20% on voltage and current) and consider thermal derating under elevated ambient conditions. Link: When implementing, label test conditions in your documentation (VIN, load, ambient) to match datasheet test conditions for meaningful comparisons. Parameter (example)Representative Value*Test Condition / Notes Absolute VIN maxSee datasheetDo not exceed; confirm variant table Peak switch currentDevice table valuePulse limits apply; consult SOA Nominal switching frequency≈100 kHz (typical)Frequency varies with part and conditions Junction temperature rangeDevice tableFollow thermal derating guidance Point: The table above is a placeholder; exact numbers must be copied from the official datasheet table and annotated with test conditions. Evidence: The manufacturer’s tables provide the authoritative values. Explanation: Always transcribe the datasheet numerical limits into the project’s constraint table with the same temperature and test-condition notes to avoid mismatches during validation. Electrical characteristics: DC & AC parameters Point: Electrical characteristics split into DC (Vref, line/load regulation, quiescent current) and AC/switching (frequency, peak current, rise/fall times). Evidence: Datasheet electrical-characteristics tables show guaranteed min/typ/max columns under defined test conditions (e.g., TJ = 25°C, specified VIN and load). Explanation: When designing, pay close attention to which column (typical vs maximum) applies to your margining: use max values for current limits and thermal calculations, and typical values for performance expectations. For switching behavior, note that rise/fall times and propagation delay determine switch-node ringing and snubber requirements—measure these on the bench if loop stability or EMI is marginal. Thermal, SOA and reliability-related specs Point: Thermal resistance (θJA/θJC), safe operating area for the switch, and junction temperature limits drive heatsink and layout decisions. Evidence: The datasheet provides θJA and θJC for the package and often an SOA graph for the internal switch demonstrating allowable VDS vs current for different pulse widths and ambient temperatures. Explanation: For a TO‑220‑7 package do a simple thermal calculation: estimate power dissipation (P = ILOAD × (VIN−VOUT) × duty losses + switching losses), convert to junction rise via θJA (ΔTj = P × θJA), and verify Tj remains below the recommended maximum under worst-case ambient. If the predicted ΔTj is large, specify a heatsink or use forced convection; add margin for worst-case manufacturing variability and long-term reliability. Link: Use the datasheet SOA plots when choosing application duty cycles and transient limits. 3 — Design & Layout Guidelines (method / how-to) Component selection & reference BOM (inductors, diodes, caps) Point: Correctly sized passive components are as important as the regulator choice. Evidence: Reference designs and datasheet application notes list recommended ranges for inductance, diode types, and capacitor ESR to achieve stable operation. Explanation: Select an inductor with saturation current at least 20–30% above the peak switch current and with DCR low enough to limit conduction loss but high enough to damp ringing. Use a fast, low-recovery Schottky catch diode sized for average output current and peak reverse voltage; for higher efficiency consider synchronous replacements only where gate-drive compatibility exists. For capacitors, prefer low-ESR electrolytics or ceramic/output capacitor blends per datasheet guidance; high ESR can improve stability in some compensation schemes but increases ripple and heat—balance per the datasheet’s recommended values. Example ranges: for a 5 A design, inductor values often fall in the 10–33 μH range depending on switching frequency and ripple current targets; output capacitance in the hundreds to thousands of μF may be required for low ripple and transient control (verify with datasheet and transient targets). PCB layout & grounding tips for LT1074IT7 Point: Layout governs EMI, stability, and thermal performance. Evidence: Application notes highlight minimizing high‑di/dt loop area and placing input capacitors close to the device. Explanation: Keep the switch loop (switch node, input cap, diode/inductor) compact and use wide copper for current paths. Place the input decoupling capacitor adjacent to the VIN and ground pins to reduce common impedance. Ensure thermal path from the TO‑220 tab to a heatsink or copper pour is unobstructed; implement a solid analog ground plane and route high-current returns directly to the device’s ground pin to avoid shared returns with sensitive feedback networks. Add small RC snubbers or a ferrite bead across the switch node if ringing or EMI exceed limits. Mark thermal vias and solder the tab per the package mounting recommendations for best θJC performance. Setting output voltage & compensation Point: The output voltage is set with an external resistor divider and, when necessary, compensation network components. Evidence: The datasheet gives VREF and feedback thresholds plus example divider formulas. Explanation: Use the reference voltage in the datasheet to compute the resistor divider: Rtop = Rbottom × (VOUT/VREF − 1). Choose resistor values that keep the divider current sufficiently above noise but below loading that increases quiescent power—typical total divider currents are in the 50 μA to 1 mA range. If external compensation is required use the datasheet’s recommended component values as a starting point and tune on the bench: check loop stability with a load step and scope the control node for ringing or excessive phase lag. For a 5 V output using a 1.25 V reference, Rbottom = 10 kΩ gives Rtop ≈ 30 kΩ (simple example; confirm VREF from datasheet). 4 — Typical Application Circuits & Case Studies (case) Standard step-down reference designs Point: The datasheet typically provides canonical circuits: fixed-output, adjustable, and sometimes negative-output topologies. Evidence: Reference circuits illustrate required component choices and expected performance envelopes. Explanation: Fixed-output designs simplify the feedback network but limit flexibility; adjustable versions use the resistor divider and may include compensation parts. Negative outputs, when shown, demonstrate how the switching topology can be adapted with additional components. For each reference circuit examine the listed component values, thermal notes, and the expected output ripple/transient numbers—replicate these in prototype before optimizing for cost or size. Example: 12V→5V, 5A design walkthrough Point: A pragmatic example helps translate datasheet numbers into a working BOM. Evidence: Combine the device characteristics (switch current, switching frequency) with passive selection rules to derive component values. Explanation: For 12 V input to 5 V output at 5 A, first calculate required duty ratio (roughly VOUT/VIN minus diode drop considerations) and expected switch current including ripple. Choose an inductor with Isat ≥ 6.5–7 A, low DCR to keep conduction losses low, and L value to limit ripple to ~20–30% of IOUT. Select a Schottky rated >VOUT with average current ≥6 A and low forward drop at expected current. Estimate efficiency by summing conduction and switching losses—typical predicted efficiency will be 75–85% depending on inductor loss and diode drop. Thermal margin: compute worst-case dissipation and choose a heatsink/airflow that keeps Tj under the datasheet’s recommended limit with margin. Verification: measure switch-node waveform for acceptable ringing, output ripple under load, and transient recovery in response to a step from 0.5 A to 5 A. Troubleshooting common behavior & failure modes Point: Common issues include oscillation, overheating, poor transient response, and excessive ripple. Evidence: Field reports and datasheet application notes list root causes and remedies. Explanation: If oscillation appears, check feedback network values and layout—move feedback sense trace away from switch-node noise and use proper grounding. Overheating often arises from underestimated conduction or switching losses; confirm inductor DCR and diode Vf, and re-evaluate θJA assumptions. Poor transient response can be improved by increasing output capacitance, reducing ESR where appropriate, or tuning compensation. If excessive ripple persists, verify inrush filtering and input decoupling and add a small LC filter or adjust snubber components. Use a systematic test checklist: isolate variables (load, VIN, layout) and make one change at a time to identify the corrective action. 5 — Procurement, Testing & Implementation Checklist (action) Sourcing, part numbering & compliance Point: Correct part ordering and awareness of lifecycle status prevents assembly and field trouble. Evidence: Distributor listings and manufacturer product pages show suffixes like PBF (Pb‑free) and packing codes. Explanation: Read the full part number (example: part# with suffixes) to confirm package, temperature rating, and lead finish. Cross-reference manufacturer part numbers against distributor SKUs and check for obsolescence notices; if the LT1074 family is flagged as legacy, consider cross-references or modern replacements. For compliance, record RoHS/Pb-free status, and retain the supplier’s certificate of conformance in procurement records. Test plan & verification checklist for production Point: A concise validation matrix ensures production reliability. Evidence: Typical verification plans include input-range sweep, load regulation, transient load step, thermal cycling, and EMI pre-checks. Explanation: Define pass/fail criteria: output within ±2% at full load, transient recovery within target time, thermal rise within design allowance, and EMI below specified limits at key bands. Suggested tests: VIN sweep from minimum to maximum recommended VIN, steady-state thermal soak at max ambient, step-load from 10% to 100% load to measure recovery and overshoot, and board-level conducted immunity/EMI pre-scans. Automate test sequences where possible to speed throughput during production validation. Final deployment & maintenance notes Point: Field longevity benefits from derating and spares planning. Evidence: Reliability practice recommends component derating and documented maintenance intervals. Explanation: Apply conservative derating for the switch current and junction temperature; keep spares for the active regulator and critical passives (inductors, diodes, electrolytic caps) in service kits. Document power-up sequencing requirements and interactions with system firmware that may enable/disable rail sequencing. Plan for periodic inspection of electrolytic capacitors and temperature-stressed components in long-running deployments. Summary The LT1074IT7 is a robust member of the LT1074 family; using the official datasheet to extract device limits and application circuits ensures correct specs and avoids field issues—verify ordering codes and package tables before procurement. Design focus should be on appropriate inductor saturation margin, low-loss diode selection, and tight PCB layout to minimize the switch loop and thermal resistance; always match test conditions to datasheet tables when comparing results. Follow a short validation plan (VIN sweep, load regulation, transient step, thermal soak, EMI pre-check) and maintain a procurement record of part numbers and compliance certificates to reduce production risk and simplify maintenance. Frequently Asked Questions What should a designer verify in the LT1074 datasheet before choosing the part? Designers should confirm absolute maximums, recommended operating conditions, peak switch current, switching frequency, thermal resistance, and the SOA graphs in the datasheet. These entries determine maximum VIN, allowable pulse currents, heatsinking needs, and whether the part meets system safety and thermal requirements under the intended duty cycle. How does one size the inductor and diode for a 5 A output using this regulator family? Select an inductor with saturation current at least 20–30% above the peak switch current and low enough DCR to meet efficiency targets; choose a Schottky diode rated for the average output current and peak reverse voltage with low forward drop. Use ripple-current targets (20–30% of IOUT) to pick inductance and verify thermal dissipation for both passive parts. What are the most effective PCB layout changes to reduce EMI and improve stability? Minimize the high-di/dt switch loop area by placing the input decoupling capacitor adjacent to VIN and ground pins, route the switch node minimally, provide a solid analog ground plane, and separate sensitive feedback traces from the switching node. Add snubbers or ferrite beads at the switch node only if measured ringing causes EMI or instability.
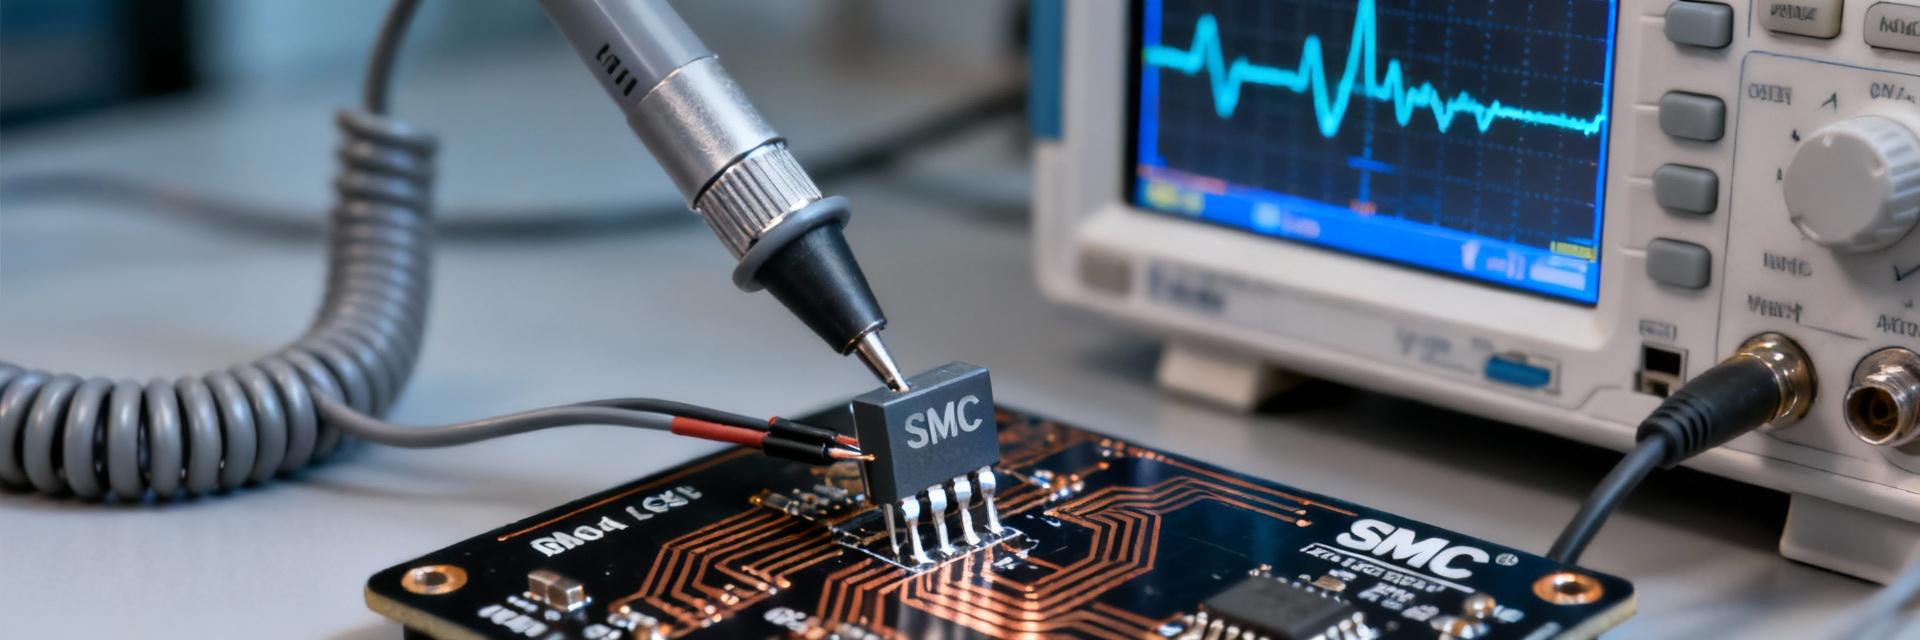
LT1074IT7: Complete Specs & Key Parameters Breakdown
15 November 2025
The FDP027N08B is a high‑current N‑channel PowerTrench MOSFET rated at 80 V with sub‑3 mΩ on‑resistance and continuous currents specified above 200 A—parameters that make it a go‑to for motor drives, DC‑DC converters and power supplies. This deep‑dive decodes the FDP027N08B datasheet and typical test data so engineers can quickly assess fit, limits and test methods for real designs. (Source: onsemi datasheet) Point: summarize intent and immediate applicability. Evidence: the manufacturer’s datasheet lists the device’s key limits and test conditions that form the basis for safe use. Explanation: designers should map datasheet conditions to system conditions (gate drive, temperature, PCB thermal path) before committing to the device. Link: manufacturer datasheet is the primary reference (onsemi datasheet). 1 — Background & Product Overview (type: background) What the FDP027N08B is and where it came from Point: device identity and lineage. Evidence: the FDP027N08B is listed in onsemi’s low/medium voltage MOSFET portfolio and appears in historical Fairchild/ON heritage catalogs. Explanation: it is a silicon PowerTrench N‑channel optimized for low RDS(on) in a through‑hole TO‑220‑3 style package, intended for high‑current low‑voltage switching such as motor drive low‑side, synchronous rectification and power distribution. The part is commonly cross‑referenced on distributor pages where stock may be intermittent; lifecycle status can vary by supplier, so sourcing should check manufacturer stock and lifecycle notes. Link: consult the manufacturer datasheet and distributor pages for sourcing and lifecycle confirmation (onsemi datasheet). Core electrical ratings at a glance Point: headline ratings designers check first. Evidence: datasheet typical entries include VDS = 80 V, continuous drain current listed (e.g., ~223 A depending on mounting and Tc), maximum VGS ±12 V or ±20 V on some sheets, maximum junction temperature Tj,max = 175°C, and RDS(on) typical vs max reported at specified VGS and 25°C. Explanation: the 80 V rating and very low RDS(on) make the device suited for sub‑80 V systems, but continuous current figures assume ideal thermal sinking—real continuous current must be derated for PCB thermal resistance and ambient. Rule of thumb: limit VGS drive to the datasheet recommended safe gate drive (commonly 10–12 V), derate RDS(on) for temperature (roughly a linear increase with junction temperature per the RDS(on) vs Tj curve). Link: key ratings are summarized from the official datasheet (onsemi datasheet). Typical package, thermal and mechanical notes Point: package and thermal behavior. Evidence: the package listed is a TO‑220‑3 style PowerTrench package with defined RθJC and RθJA in the datasheet; typical RθJC is low (single‑digit °C/W) while RθJA depends heavily on board copper and mounting. Explanation: for bench and production, use a dedicated heatsink or large copper area, proper mounting torque and an insulating pad if required. For screw mounting, follow torque specs in the mechanical notes and use a mica or silicone insulator when isolation is needed; ensure thermal grease or pad is applied to reduce interface thermal resistance. Link: mechanical drawings and thermal resistance numbers are documented in the datasheet (onsemi datasheet). Quick reference: key spec snapshot (typical datasheet values) ParameterValue (typ)Notes / Test Conditions VDS80 VDrain‑Source breakdown rating Continuous ID~223 ACase‑based rating, requires heatsink RDS(on)sub‑3 mΩ (typ)Measured at VGS = 10 V, Tj = 25°C VGS,max±12 V (typ)Check sheet variant for ±20 V listings Tj,max175 °CMaximum junction temperature PackageTO‑220‑3 / PowerTrenchThrough‑hole, screw mount 2 — Datasheet Key Specifications Explained (type: data analysis) RDS(on): measurement conditions and real-world meaning Point: RDS(on) is the primary determinant of conduction loss. Evidence: the datasheet gives RDS(on) at specific VGS (commonly 10 V) and at 25°C, with typical and maximum columns; an RDS(on) vs temperature curve shows increase with Tj. Explanation: to estimate conduction loss use P = I^2 × RDS(on). Example: at 100 A and RDS(on) = 3 mΩ, P = 100^2 × 0.003 = 30 W dissipated in the MOSFET—this is junction heating requiring substantial thermal path. Designers should calculate junction rise using ΔTj = P × RθJC (for short pulses) or P × RθJA (steady state on PCB). Link: values and temperature curves are available in the datasheet (onsemi datasheet). Avalanche, SOA and switching limits Point: avalanche energy and SOA limit inductive switching. Evidence: the datasheet provides single‑pulse avalanche energy and often SOA charts showing allowable VDS/ID combinations for given pulse widths. Explanation: single‑pulse avalanche is not a license for repetitive transients—designers should derate for repetitive or high‑frequency transients and use snubbers or TVS diodes for inductive loads. When switching inductive loads, ensure the energy per event and repetition rate keep junction excursions within limits; use SOA curves to confirm safe operating envelopes. Link: avalanche and SOA data are specified in the datasheet (onsemi datasheet). Gate characteristics and switching performance Point: gate charge and capacitances determine switching behavior. Evidence: datasheet lists VGS(th), total gate charge QG at specified VGS and VDS, and parasitic capacitances Ciss, Coss, Crss. Explanation: QG sets the energy the gate driver must supply; switching loss approximation due to gate charging is Egate ≈ QG × Vdrive, and switching losses on the drain are influenced by dv/dt and Miller capacitance (Crss). For example, a gate drive of 10 V and QG = 60 nC implies ~0.6 mJ per switching transition, which at 100 kHz equals 60 W in gate drive energy (split between turn‑on and turn‑off efforts and driver dissipation). Choose a gate driver with adequate peak current and control turn‑on dv/dt via series gate resistors to manage overshoot. Link: gate charge and capacitance tables are in the datasheet (onsemi datasheet). 3 — Typical Test Data & Performance Analysis (type: data analysis) Interpreting the datasheet’s typical curves Point: which curves to inspect and how. Evidence: typical datasheet curves include ID vs VDS, transfer characteristics (ID vs VGS), RDS(on) vs Tj, and switching waveforms. Explanation: read ID vs VDS to understand linear/ohmic regions and saturation onset; use transfer curves to determine required VGS for a target ID; use RDS(on) vs Tj to derate conduction loss at elevated temperature. Extract design points by reading the current at the gate voltage you can supply and then applying thermal derating. Link: these typical curves are included in the manufacturer’s datasheet (onsemi datasheet). Example performance calculations from test data Point: worked examples speed decision making. Evidence: using datasheet RDS(on) and thermal numbers supports concrete estimates. Explanation: example 1 — conduction loss at 150 A with RDS(on) = 3 mΩ: P = 150^2 × 0.003 = 67.5 W. Example 2 — junction rise for steady 67.5 W on a board with RθJA = 1.0 °C/W (heatsink case will be lower): ΔTj ≈ 67.5 × 1.0 ≈ 67.5 °C above ambient; ensure Tj,max not exceeded. Example 3 — switching loss estimate at 50 kHz with VDS transition of 48 V and ID = 50 A over 50 ns: energy per transition E ≈ 0.5 × V × I × t ≈ 0.5 × 48 × 50 × 50e‑9 ≈ 60 µJ, switching power Psw = E × f ≈ 3 W. Sum switching and conduction losses for total device dissipation and compare against thermal budget. Link: use datasheet curves and numbers for input parameters (onsemi datasheet). Comparing datasheet vs measured results (what diverges) Point: expect lab vs sheet differences. Evidence: datasheet conditions are tightly controlled (pulse widths, fixture thermal anchoring, Kelvin senses). Explanation: real bench or production measurements often show higher RDS(on) and switching losses due to contact resistance, long leads, PCB thermal limitations, and thermometer placement. Mitigate by using Kelvin sense for RDS(on), controlled pulse widths to avoid self‑heating, and replicate the datasheet test fixture as closely as possible. Link: measurement pitfalls and recommended corrections are summarized from measurement best practices and datasheet test notes (onsemi datasheet). 4 — How to Test FDP027N08B: Measurement Methods & Test Setup (type: method guide) Recommended bench setup for RDS(on) and transfer curve tests Point: recommended measurement hardware and procedure. Evidence: standard practice uses a precision source meter or pulsed current source, pulse generator for gate, oscilloscope and Kelvin sense wiring; datasheet lists pulse conditions to avoid self‑heating. Explanation: mount the device on a metal plate or heatsink, use Kelvin connections for drain/source, choose pulse widths (e.g., Switching tests: layout and measurement tips Point: layout and probe placement matter most in switching tests. Evidence: parasitic inductance in loop leads to overshoot and ringing; datasheet switching waveforms assume low‑parasitic fixtures. Explanation: minimize loop area for the drain‑source current path and place the current probe around the DC return or use a Rogowski/probe close to the device. Use a high‑bandwidth differential probe for VDS and a low‑inductance current probe. Add small series gate resistors to tune dv/dt and reduce ringing; capture both voltage and current waveforms at the same time to compute switching energy. Link: measurement layout guidance is consistent with datasheet test descriptions (onsemi datasheet). Thermal characterization and junction temperature estimation Point: practical methods to find RθJC and RθJA. Evidence: datasheet provides RθJC and example RθJA for reference PCB; for accurate validation use thermocouples and IR imaging. Explanation: attach a fast thermocouple to the package tab for approximate case temperature and use IR imaging to map hot spots on the die area (account for emissivity). For RθJC, short power pulses and measure junction‑to‑case rise; for RθJA use steady‑state power and measure ambient‑to‑case difference. Use these to calibrate thermal model and estimate junction temperature under expected duty cycles. Link: thermal measurement methods align with the datasheet’s thermal notes (onsemi datasheet). 5 — Practical Recommendations: Selection, Substitutes & Design Considerations (type: action/case) When to choose the FDP027N08B (and when not to) Point: application fit guidance. Evidence: given low RDS(on), high ID rating and 80 V rating, the device is ideal for high‑current low‑voltage switching such as motor low‑side switches, DC bus distribution and synchronous rectifiers. Explanation: avoid the part for extremely high‑frequency switching (>200–300 kHz) where package inductance and gate charge impair efficiency, or where SMD form factor is mandatory. If the design requires repetitive avalanche tolerance or extreme SOA margins, choose a device with explicit repetitive avalanche or higher SOA margins. Link: application guidance derived from datasheet electrical and SOA data (onsemi datasheet). Common substitutes and cross-reference guidance Point: substitution strategy. Evidence: replacement should match VDS, RDS(on) at VGS, package thermal specs and total gate charge QG. Explanation: when cross‑referencing, ensure pinout and mounting form factor match (TO‑220‑3 screws and tab footprint differ across makers), and verify SOA and avalanche specs; test suspected substitutes under realistic thermal and switching conditions before committing. Link: use datasheet comparisons and vendor cross‑reference tables for candidates (manufacturer datasheets). PCB layout, gate drive and thermal best practices Point: concrete layout and drive tips. Evidence: datasheet switching examples and general best practices show the impact of loop inductance and gate drive impedance. Explanation: keep the switching loop (Vbus, device, return) as small as possible; use a short Kelvin source trace to the current sense resistor if present; place the gate driver close to the MOSFET, use a small series gate resistor (tune for rise/fall balance), and include snubbers or RC damping for inductive loads. For thermal, allocate generous copper area, thermal vias under the device pad, and a heatsink or forced airflow to meet RθJA targets and maintain junction below Tj,max. Link: layout and thermal recommendations are consistent with datasheet test notes and industry best practices (onsemi datasheet). Summary The FDP027N08B is an 80 V, very low RDS(on) power MOSFET suited to high‑current low‑voltage switching; verify gate drive and thermal path against datasheet test conditions before use (FDP027N08B reference: onsemi datasheet). Use pulsed RDS(on) tests with Kelvin sensing and replicate datasheet pulse widths to avoid self‑heating; calculate conduction loss with P = I²R and combine with switching loss estimates from QG and measured dv/dt. For switching tests, minimize loop inductance, use appropriate gate resistors and capture VDS/ID with high‑bandwidth probes; thermally, design for worst‑case ambient and required heatsinking using RθJA/RθJC guidance. 6 — FAQ What is the recommended gate drive voltage for this MOSFET? Answer: The datasheet lists test conditions at VGS = 10 V for typical RDS(on) performance, and maximum allowable gate voltage is shown as ±12 V on common documentation. Use a stiff 10–12 V gate drive for lowest RDS(on), avoid over‑voltage on the gate and ensure the driver can source the peak current required by the device’s QG. (Source: onsemi datasheet) How do I estimate junction temperature for a given steady current? Answer: Calculate conduction and switching losses using datasheet RDS(on) and switching energy estimates, sum to get total device power P. Multiply P by RθJA (board‑dependent) to get ΔT above ambient, then add ambient to get estimated Tj. For short pulses use RθJC for transient junction rise. Verify with thermocouples or IR imaging against datasheet thermal limits. (Source: onsemi datasheet) Are there direct drop‑in SMD equivalents for this through‑hole part? Answer: Direct drop‑in SMD equivalents are uncommon because thermal and parasitic behaviors differ; when substituting to an SMD device, match VDS, RDS(on) @ VGS, Qg and package thermal performance, and validate pinout and SOA. Always bench‑test the substitute in your application conditions. (Source: manufacturer and distributor datasheet comparisons)
FDP027N08B MOSFET Datasheet Deep-Dive: Key Specs & Test Data
14 November 2025
Terminal-block interposing relays like the 700‑HLT family are specified in an estimated 40–60% of industrial control panels for signal isolation and high‑density mounting — making correct selection and implementation essential for uptime. This report delivers a concise, data‑driven walkthrough of the PAL6055.700HLT: a datasheet‑level summary of its technical specifications, integration guidance and a practical selection checklist to support design, procurement and maintenance decisions. The goal is to translate vendor datasheet values and field practice into actionable engineering steps for PLC I/O isolation, control‑panel densification and reliable lifecycle management. 1 — Product overview & model family (background) Model identity & intended use The PAL6055.700HLT is presented as an interposing/isolation relay in the 700‑HLT terminal‑block family, intended for dense control panels where channel separation, contact isolation and convenient DIN/rail or terminal mounting are required. Typical applications include PLC input and output interposing, signal isolation between field sensors and logic controllers, and high‑density control cabinets where space and maintainability are priorities. As an interposing relay, the device provides galvanic separation and contact buffering between field circuits and control electronics, protecting PLC inputs from transient events and enabling easy field‑level replacement without disturbing PLC wiring. High-level electrical & mechanical highlights At a glance, the 700‑HLT family offers DPDT (2‑pole) contact arrangements commonly rated near 10 A continuous for the general series, with variants supporting common coil voltages used in industrial systems (e.g., 12 VDC, 24 VDC, 24 VAC, 120 VAC). Termination styles are typically captive screw terminal blocks optimized for ferrule termination, and mechanical mounting is focused on DIN‑rail or compact terminal‑block stacking. Full contact, coil and mechanical drawings are provided in the official datasheet and are referenced throughout this report for final verification of pinout and mechanical clearances. Ordering codes & common variants Ordering nomenclature in the 700‑HLT family generally encodes coil voltage, contact material (standard silver alloy vs. gold‑plated for low‑level signals), and terminal option (screw vs. push‑in). The PAL6055.700HLT mapping typically indicates a standard DPDT isolation relay with the specified coil option and terminal style — confirm the suffixes for coil voltage and contact plating when raising POs. When sourcing, cross‑references to like Allen‑Bradley 700 series family parts or equivalent OEM interposing relays can shorten lead times; always request the vendor’s complete ordering code explanation and the manufacturer’s datasheet PDF to ensure electrical ratings and agency approvals match project requirements. 2 — Electrical specifications deep-dive (data analysis #1) Contact ratings & switching capacity Contact ratings are central to correct relay selection. For typical 700‑HLT devices the nominal continuous current rating is in the 8–12 A range (10 A common), with AC and DC voltage ratings listed per contact in the datasheet. Inrush or switching currents (for lamp or capacitive loads) can exceed steady‑state ratings and must be checked against the datasheet’s AC/DC switching tables and pilot duty curves. When reading the contact rating tables, verify the test conditions (ambient temperature, resistive vs. inductive load, utilization category such as AC‑15/DC‑13) and identify any stated derating for inductive loads. If a datasheet lists pilot duty, match that to your load category; failing to do so risks premature contact welding or pitting under frequent switching cycles. Coil specifications & power consumption Coil specifications include nominal coil voltage(s), coil power (typically expressed in W or mA at nominal voltage), pull‑in and drop‑out voltages (expressed as percentage of nominal), and coil resistance at 20 °C. These parameters determine driver sizing: ensure the relay driver (PLC transistor output, driver IC or relay driver transistor) can supply inrush coil current and hold current, and confirm transient suppression strategy to avoid damaging the driver. Datasheets usually provide coil resistance and nominal coil power; use these to calculate steady‑state supply loading and to size fusing/protection on the control side. Electrical life & performance curves Datasheet life curves separate mechanical life (operations without electrical load) from electrical life (operations under specified load). Typical mechanical life for a terminal‑block relay may be in the millions of cycles, whereas electrical life under resistive or inductive loads will be lower (often specified in hundreds of thousands of cycles for resistive loads and fewer for heavy inductive switching). Review manufacturer life curves to determine expected MTTF for your switching profile, and adopt contact protection (RC snubbers, diodes for DC coils, TVS or surge suppressors on the supply lines) where inductive load switching or high transient environments are expected to extend contact life and reduce arcing damage. Parameter Typical Value / Note Contact arrangement DPDT (2‑pole) Nominal continuous current ~10 A (check datasheet for exact model) Coil voltages Common: 12 VDC, 24 VDC, 24 VAC, 120 VAC (verify ordering code) Pull-in / Drop-out Specified as % of nominal; use datasheet values for driver design 3 — Mechanical, environmental & safety specs (data analysis #2) Dimensions, mounting & pinout Mechanical drawings in the manufacturer datasheet provide exact footprint, terminal spacing, and pin assignments. For terminal‑block relays, critical details include terminal pitch, conductor entry direction, and torque specifications for screw terminals (over‑ or under‑torquing can cause poor contact or stripped screws). Confirm whether the part is intended for DIN‑rail snap mounting or fixed panel/rail mounting and check clearance for adjacent modules when stacking. When designing panels, include the datasheet mechanical callouts to ensure adequate spacing for ventilation and hand access during replacement. Environmental limits & thermal behavior Operating and storage temperature ranges, humidity tolerance and altitude limits are specified in the datasheet. Thermal current (Ith) and ambient derating guidance are essential: contact current capacity often decreases with elevated ambient temperature, so apply the manufacturer’s derating curve for continuous currents. In high‑density assemblies, account for mutual heating between adjacent relays and other heat‑generating components; use manufacturer thermal guidance and, if necessary, derate the current or provide forced ventilation to maintain reliability. Certifications, compliance & standards Verify listed agency approvals (UL/cUL, CE/EN, RoHS) and insulation ratings per IEC/VDE in the datasheet. Look for dielectric strength and impulse withstand voltages to validate isolation between coil and contacts and between different contact sets. Agency file numbers and test references are typically cited in the datasheet or the vendor’s certification pack — request these files for safety documentation and to support regulatory compliance audits. 4 — Integration & design best practices (method guide) Wiring, pinout mapping & terminal best practices Use ferrules on stranded conductors and adhere to manufacturer torque specs to prevent loose terminations. Document a standard mapping from field signals to relay terminals and from relay contacts to PLC I/O: for interposing relays, wire the field sensor into the common and NO/NC contacts per the desired fail‑safe behavior. Label both the field side and PLC side clearly in the panel, and include terminal block designation on the schematic to prevent miswiring during maintenance. For coil suppression, use flyback diodes for DC coils and RC snubbers for AC coils where indicated in the datasheet. PCB vs. terminal-block installations & mechanical support Choose PCB‑mounted variants when board integration and minimal panel wiring are priorities; select terminal‑block relays when field wiring flexibility, hot‑swap replacement and higher mechanical robustness are required. For terminal‑block installations, provide mechanical strain relief for incoming field cables and ensure the relay is secured against vibration and shock per the datasheet’s mechanical limits. Where space allows, orient relays to ease airflow and heat dissipation. Testing, diagnostics & protective measures Before commissioning, bench‑test coil resistance, contact continuity and insulation resistance using a megohmmeter as recommended in the datasheet. In situ, monitor coil current and verify contact actuation with test points on the PLC input; implement diagnostics for stuck contacts or coil failure. Protect relay contacts switching inductive loads with appropriate RC snubbers, TVS diodes or contactors depending on load magnitude. Common failure modes include welded contacts from sustained inrush, coil burnout from overvoltage, and loose terminal connections; include these in commissioning checklists and maintenance procedures. 5 — Real-world integration case study (case study) Sample use: PLC input isolation panel Consider a PLC input panel that isolates 32 field channels using PAL6055.700HLT style interposing relays. Each field sensor is wired to the relay input; the relay contact provides a clean, isolated pulse to the PLC input module. Choose coil voltage compatible with the panel control bus (for example, 24 VDC) and confirm contacts are rated to handle any loop‑powered sensor current and inrush. During design, verify contact material if low‑level DC sensing is used (gold plating reduces contact resistance and oxidation). Document the wiring mapping and label each relay to simplify swap‑outs during field service. Field troubleshooting example A common fault is a channel that reads stuck ON. Troubleshooting steps: (1) Verify coil supply voltage and measure coil resistance — an open coil indicates failed relay; (2) Check contact continuity with the relay de‑energized and energized to detect welded contacts; (3) Inspect terminal torque and wiring for intermittent connection; (4) Review load type — frequent inductive switching without protection may have pitted the contacts. Corrective actions include replacing the relay, adding appropriate suppression, or derating the contact for the application. Procurement & lifecycle notes from the field Field experience shows common constraints: lead times for specific coil voltage or gold‑plated contact variants can be longer, so maintain a small critical spares stock (3–5% of installed units per site) for critical panels. When sourcing alternates, ensure electrical life curves and agency approvals match. Save the vendor datasheet PDF and mechanical drawing with the panel documentation; include part number, lot code and procurement date in the asset register to simplify future lifecycle actions. 6 — Selection checklist & action steps for engineers (action recommendations) Quick-spec checklist before buy Before procurement, verify: coil voltage and power consumption; contact current rating and switching category (resistive vs. inductive); contact material for low‑level signals; insulation and dielectric ratings; mounting compatibility (DIN‑rail, terminal pitch); ambient derating guidance; and required agency certifications. Always consult the official datasheet PDF for final numeric values and ordering codes before issuing PO. Sizing, protection & long-term reliability actions Size contacts with a margin above expected continuous and inrush currents and choose suppression appropriate to the switched load (RC snubber for AC inductive loads, diode for DC coils, TVS for transient suppression on control rails). Implement preventive maintenance intervals driven by duty cycle and life curves: for heavy duty switching, schedule periodic contact inspections or replacements based on the manufacturer’s electrical life data. Procurement & documentation to request Request the full datasheet, mechanical drawing, electrical life test curves, and agency certification files from vendors. Archive the PAL6055.700HLT data package within project documentation and record the exact ordering code, manufacturing lot and supplier to enable traceability and faster replacement in the field. Summary This datasheet‑level review shows that the PAL6055.700HLT delivers compact DPDT interposing capability, standard industrial contact ratings near 10 A for the family, and flexible terminal‑block mounting suitable for PLC isolation panels. Critical checks include confirming coil voltage and power, matching contact rating to load and verifying environmental and certification requirements from the official datasheet. Proper coil drive design, contact protection and maintenance scheduling are pivotal to achieving long service life in dense control panels. Verify coil voltage and coil power against your control bus before ordering; consult the official datasheet for exact values (PAL6055.700HLT). Match contact rating to steady and inrush currents; specify contact protection (RC/TVS/diode) for inductive loads. Check mechanical drawings and torque specs for terminal wiring and panel layout to avoid thermal and mechanical issues. Request full life‑test curves and agency certification files from suppliers to support procurement and compliance. — Common Questions What technical specifications should I validate on the PAL6055.700HLT before design? Validate coil voltage and steady coil power, pull‑in/drop‑out voltages, contact continuous and inrush ratings, utilization category (AC‑15, DC‑13 as applicable), insulation and dielectric withstand levels, and ambient derating curves. Confirm mechanical mounting, terminal torque and pinout from the official datasheet to avoid fitment and wiring errors. How do I protect contacts when switching inductive loads with a 700‑HLT relay? Use RC snubbers or surge suppressors sized for the expected transient energy; for DC coils, include flyback diodes on the coil side (but note diodes increase drop time—choose suppression to match response requirements). For heavy inductive loads, consider hybrid protection (RC + TVS) or external contactors if energy exceeds relay pilot duty ratings. What spare policy is recommended for PAL6055.700HLT in critical panels? Maintain a small onsite spare pool (typically 3–5% of installed count for critical systems), plus one or two common coil voltage variants. Track supplier lead times and keep the datasheet and ordering codes in the asset record to expedite replacements.
PAL6055.700HLT Datasheet: Complete Technical Report
13 November 2025
The Tamura L34S1T2D15 is rated for 1200 A continuous primary current and uses a 15 V supply—specs that position it for high-current industrial power, inverter and EV charger applications. This article unpacks the L34S1T2D15 datasheet and specifications so engineers can quickly assess fit, limits, and integration steps. The discussion references the manufacturer's datasheet tables and common distributor product listings for practical procurement context. Engineers evaluating a high-current Hall-effect transducer need a concise reading of rated current, supply and output topology, thermal derating, and mechanical aperture constraints before PCB or panel-level integration. The following sections synthesize the official datasheet details, typical application roles, performance limits, and step-by-step validation guidance to accelerate design and test cycles. 1 — Background: what the Tamura L34S1T2D15 is and where it’s used Overview: sensor type & core functionality Point: The L34S1T2D15 is an open-loop Hall-effect current transducer with a single-channel, ratiometric voltage output and bidirectional detection capability. Evidence: The manufacturer's specification sheet identifies the device as an open-loop Hall topology with ratiometric output tables defining typical output behavior. Explanation: Open-loop Hall sensors measure magnetic field proportional to primary conductor current without using a magnetic feedback coil, simplifying mechanical design and offering wide aperture options for large busbars. For a ratiometric device the zero-current output is typically centered at half the supply voltage (VCC/2), and the output shifts above or below that center proportional to current polarity and magnitude. Link: Consult the official Tamura product datasheet tables for the exact output expression, recommended supply tolerance, and pinout details as you draft the measurement electronics. Typical applications & system roles Point: The device is aimed at high-current power systems where 1200 A capability is required. Evidence: Datasheet rated-current and application notes commonly list motor drives, EV chargers, UPS/inverters, battery energy storage systems (BESS), power meters, and industrial bus monitoring as primary uses. Explanation: In these systems, a 1200 A rating allows direct measurement of large busbar currents without bespoke shunt resistors, reducing losses and simplifying thermal management. Bidirectional sensing supports regenerative flows in inverter and charger systems. For system architects this rating determines conductor sizing, mechanical aperture choice, and the required transient protection to avoid sensor saturation during fault conditions. Package, mounting & mechanical context Point: Mechanical form factor and aperture strategy are central to integration. Evidence: The datasheet describes a through-hole aperture style for panel or PCB mounting and lists footprint and mounting torque recommendations. Explanation: Through-hole aperture transducers accept either busbars or bundled conductors—proper fill of the aperture ensures the magnetic field seen by the Hall element matches datasheet calibration. Panel mounting and clearance dimensions determine whether the sensor can be placed adjacent to other components; designers should obtain ECAD/footprint files from the manufacturer or distributor repositories when creating board and panel layouts. The datasheet also provides primary conductor fill and recommended busbar placement; follow those to limit measurement bias and avoid asymmetrical field errors. 2 — Datasheet snapshot: key electrical & mechanical specifications Electrical ratings (what to read first) Point: Start with rated current, supply voltage and output type to confirm compatibility. Evidence: The L34S1T2D15 is specified for 1200 A continuous with a 15 V supply and a ratiometric voltage output as primary electrical anchors in the datasheet. Explanation: For designers, continuous rated current sets continuous thermal and magnetic regimes; the 15 V supply defines the ADC front-end biasing and VCC-dependent output center (VCC/2). Absolute maximum values—such as max supply voltage, maximum allowable continuous or short-term overload, and any absolute output voltage limits—must be noted in the electrical tables. Before finalizing the measurement electronics select ADC ranges and input protection matched to the sensor’s Vout swing and absolute limits to prevent saturation or damage during transients. Accuracy, bandwidth & dynamic specs Point: Linearity, offset, sensitivity tolerance and bandwidth shape measurement fidelity. Evidence: The datasheet provides linearity and sensitivity tolerance bands, offset and temperature coefficients, and frequency response or bandwidth figures in the dynamic specification tables. Explanation: Linearity error and sensitivity tolerance define static measurement accuracy; offset and temperature drift determine zero stability over operating conditions. Bandwidth and response time affect transient measurement—high-frequency components of short pulses may be attenuated if the sensor’s bandwidth is limited, producing under-readings for rapid fault currents. When specifying, compare the listed bandwidth and response time against system transient characteristics (e.g., inverter switching frequencies, fault rise times) to determine if the sensor captures required dynamics or if a supplementary measurement path (fast Rogowski or shunt) is needed for protection-level sensing. Mechanical, thermal & environmental specs Point: Aperture size, thermal ranges and environmental ratings limit placement and operating envelope. Evidence: The datasheet lists aperture dimensions, mechanical drawing tolerances, recommended mounting torque, operating and storage temperature ranges, and environmental notes. Explanation: Aperture dimensions set the maximum conductor cross-section; dimension tolerances and mounting torque affect mechanical stability and repeatability. Thermal derating guidance in the datasheet indicates how continuous current capability reduces with elevated ambient temperature or restricted airflow—critical for enclosed power electronics. Finally, check IP, vibration and shock ratings where provided; absence of a high ingress protection rating may dictate enclosure-level sealing for harsh environments. 3 — Performance limits, failure modes & safety constraints Saturation, overload & transient behavior Point: The sensor has practical saturation and transient thresholds beyond which accuracy collapses or damage can occur. Evidence: Datasheet transient tables and notes define safe short-term overloads, recommended fusing, and transient immunity guidance. Explanation: Open-loop Hall sensors exhibit magnetic core saturation or sensor element saturation when primary currents exceed design thresholds, producing clipped or non-linear outputs beyond rated range. Designers must account for both expected steady overloads and rare transient spikes—use upstream current limiting, appropriately rated fuses, or fast protection devices to prevent prolonged overshoots. When reviewing the datasheet, identify the specified maximum transient current amplitude and duration, reading the footnotes that explain waveform conditions used for test (e.g., pulse width, duty cycle) to determine what protection strategy is required in your system. Linearity drift, offset stability & temperature effects Point: Temperature and aging drive offset drift and sensitivity changes that impact calibration intervals. Evidence: The datasheet provides offset vs. temperature curves, sensitivity tolerance, and long-term stability characteristics. Explanation: Expect offset drift with temperature that can be significant relative to measurement resolution at low currents; long-term stability (ppm/yr or percent/year if provided) informs maintenance calibration schedules. Bandwidth interacts with dynamic loading: heavy high-frequency content can produce apparent offset shifts if the sensor or the downstream filtering integrates energy differently. Define acceptable total error budgets (offset + linearity + temp drift + resolution) and use datasheet values to calculate calibration intervals and temperature compensation strategies in firmware or analog signal conditioning. Isolation, dielectric strength & certifications Point: Isolation ratings and safety certifications determine system-level compliance and creepage/clearance requirements. Evidence: The datasheet lists insulation voltage or dielectric strength numbers, and may reference applicable safety standards or note their absence. Explanation: The galvanic isolation provided by a through-aperture Hall sensor protects low-voltage control electronics from high-voltage primary conductors but designers must verify dielectric strength and creepage/clearance match system AC/DC bus voltages and regulatory class. If the datasheet lacks a specific certification required for your region or application, plan additional system-level testing or select a certified variant. Always cross-check manufacturer insulation numbers against system surge, working voltage and isolation withstand requirements during safety assessments. 4 — How to integrate the L34S1T2D15: practical checklist & calibration steps Mechanical & conductor guidelines Point: Proper conductor sizing, routing and mounting sequence guarantee measurement repeatability. Evidence: The datasheet includes conductor fill recommendations and mounting instructions. Explanation: Use a single conductor or busbar centered in the aperture per the manufacturer’s guidance; avoid partial fill or off-center routing that introduces bias. Choose primary conductor cross-section to avoid excessive heating inside the aperture and to match current density recommendations. During assembly follow recommended torque and mounting order to prevent mechanical stress on the transducer; consider shims or insulators if busbars need isolation. For production, document repeatable placement procedures and include a visual inspection step to confirm aperture fill before electrical verification. Power, filtering & measurement electronics Point: Supply decoupling, output filtering and ADC conditioning are necessary for accurate measurements. Evidence: The datasheet specifies recommended supply range, decoupling guidance, and output characteristics. Explanation: Use a stable 15 V supply within the recommended tolerance; place low-ESR decoupling capacitors close to the sensor VCC and ground pins to reduce supply-induced error. Implement an output RC filter sized to the required bandwidth—too aggressive filtering increases latency; too light filtering allows noise into the ADC. Because the sensor is ratiometric, design the ADC reference strategy to maintain ratiometric measurement (either use the same VCC-derived reference or compensate in firmware). Include input protection (series resistor, clamp diodes) sized to the sensor’s output limits and ADC input tolerance to protect against shorts or transients. Calibration, testing & validation procedures Point: A defined calibration and validation sequence ensures field accuracy and repeatability. Evidence: Datasheet error budgets and temperature coefficients provide the inputs for calibration planning. Explanation: Start with zeroing (offset) calibration at ambient temperature with no primary current present; record Vout0 and store calibration constants. Perform multi-point calibration against a calibrated reference standard over the expected current range to map sensitivity and non-linearity; store slope and linearity correction if permitted. Run step-response tests (fast rising and falling currents) to verify bandwidth and transient behavior, and conduct temperature cycling to quantify offset drift and adjust compensation. Define pass/fail criteria such as total error within specified percent of reading across operating temperature and load profiles, and document re-calibration intervals based on observed long-term drift. 5 — Examples, alternatives & procurement notes Example circuits & typical measurement set-ups Point: Typical ADC interface and optional op amp stages are straightforward for ratiometric outputs. Evidence: The ratiometric output centers at VCC/2 as described in the datasheet output tables; distributor product pages often show sample application schematics. Explanation: For direct ADC connection use an ADC input range that includes VCC/2 ± maximum expected Vout excursion; in many designs a resistor divider or precision differential amplifier is used if the ADC reference differs from the sensor VCC. For low-level resolution improvement an op amp stage can shift and scale the sensor output; ensure the amplifier bandwidth and common-mode range match the sensor. For bidirectional measurement wire polarity such that zero-current corresponds to mid-rail and verify expected Vout for representative currents to confirm wiring and polarity before system energization. Cross-reference & substitute parts Point: Validate aperture, bandwidth and accuracy when evaluating substitutes. Evidence: The L34 family and competing manufacturers provide variants with different apertures, sensitivities and bandwidths; distributor catalogs list cross-reference suggestions. Explanation: When substituting consider mechanical aperture size (will the busbar fit?), rated current, required bandwidth, supply voltage and pinout. Alternatives may offer higher bandwidth or certified safety ratings but different output scaling that requires redesign of the analog or firmware path. Maintain a checklist of minimum acceptable parameters (aperture, continuous current, transient rating, accuracy class, supply voltage) to quickly screen candidates during component selection. Availability, lifecycle & sourcing tips Point: Lead times and lifecycle flags affect production planning. Evidence: Distributor pages and manufacturer notices frequently show lead-time, lifecycle status and order minimums. Explanation: Check multiple authorized distributors for stock and factory lead-time; consider stocking critical sensors for production runs where long lead-times or end-of-life notices appear. Before committing to production, reconcile the datasheet revision and part number exactly with purchaser notices to avoid receiving a variant with different mechanical or electrical specifications. For long-term programs engage with the manufacturer or authorized distributor rep to obtain lifecycle commitments or last-time buy windows if a part shows discontinued flags. Key summary Tamura L34S1T2D15 is a 1200 A open-loop Hall sensor with 15 V ratiometric output—verify aperture fill and supply tolerance against your system needs to ensure accurate measurement. Read the datasheet tables for rated currents, transient limits and thermal derating; these define safe continuous operation and required protection strategies. Design the ADC and filtering around the ratiometric VCC/2 center point, decouple the 15 V supply, and implement calibration for offset, sensitivity and temperature drift. Test with step-response, multi-point calibration and temperature cycling; use distributor and manufacturer product pages to confirm availability and lifecycle status before procurement. Common questions — Tamura L34S1T2D15 What is the recommended calibration procedure for L34S1T2D15? Begin with a zero-current offset capture at ambient temperature and with the primary conductor removed or carrying zero current. Next perform a multi-point calibration using a calibrated current source or reference shunt across the operating range—capture at several points including low, mid and near-rated currents. Record slope (sensitivity) and non-linearity corrections and implement compensation in firmware or an analog correction stage. Finish with temperature cycling to quantify offset drift and adjust temperature compensation. Pass/fail should be based on total error within your system budget (for example, percent of reading across the specified temperature range). How does the L34S1T2D15 behave under overload and what protection is recommended? The sensor will show increased non-linearity and potential output clipping if primary currents exceed its design limits; prolonged overloads risk thermal damage. The datasheet lists transient and short-term overload figures—use these to size upstream protection. Recommended practices include fast-acting fuses or breakers sized for expected fault currents, current-limiting circuits, and clamping to protect the sensor output and downstream ADCs during extreme events. Always design system-level protection, not relying solely on the sensor’s intrinsic tolerance. How do temperature and bandwidth limits affect measurement accuracy for L34S1T2D15? Temperature induces offset drift and sensitivity change; bandwidth limits determine the sensor’s ability to follow rapid transients. Use the datasheet temperature coefficients to compute worst-case offset across the operating range and schedule calibration or compensation accordingly. If your system experiences fast rising fault currents or high-frequency switching components, confirm the sensor bandwidth is sufficient; otherwise consider a parallel fast sensor (e.g., Rogowski coil) for transient capture. Balance filtering to reduce noise while preserving required dynamic response.
Tamura L34S1T2D15 Datasheet Breakdown: Key Specs & Limits