SRP1238A-1R0M Datasheet: Measured Specs and Performance
Background: Spec Sheet Overview
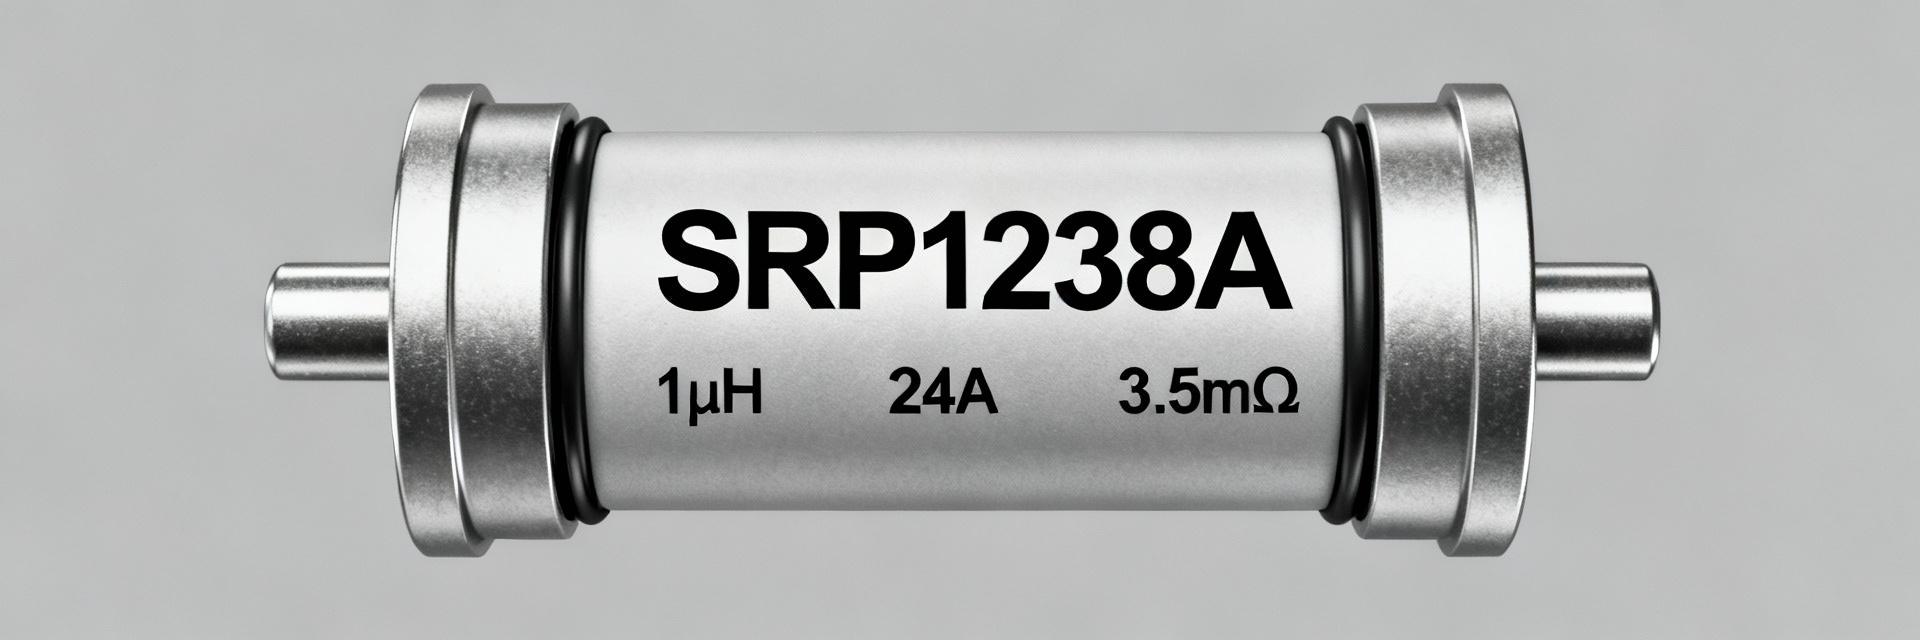
The part’s headline items include a nominal inductance of 1.0 µH, a test frequency of 100 kHz, and a saturation current (Isat) near 40 A. These test conditions (signal amplitude, frequency, and temperature) must match lab setups to reproduce the stated specs reliably before production qualification.
Key Electrical Parameters: Datasheet vs. Lab Bench
| Parameter | Datasheet Value | Measured (Typical) | Visual Margin |
|---|---|---|---|
| Inductance (@100 kHz) | 1.0 µH ±20% | 0.95–1.05 µH |
|
| DCR (@25°C) | ~3.5 mΩ | 3.4–3.8 mΩ |
|
| Rated DC Current | ≤24 A | 24 A Continuous |
|
| Saturation (Isat) | ~40 A | 38–42 A |
|
Mechanical & Mounting
The SRP1238A-1R0M is a shielded power inductor with a low-profile footprint. Recommended land patterns focus on copper thermal pours and multiple vias; insufficient copper will elevate steady-state temperatures and increase DCR.
Measured Electrical Specs
Inductance vs. DC current (bias curve) is critical. DCR measured with a four-wire Kelvin method yields ~3.5 mΩ. For a 20 A DC current, conduction loss is approximately 1.4 W (P = I² × R).
Performance Under Load and Thermal Behavior
Saturation and Peak Handling
Saturation (Isat) is defined where inductance falls by 20–30%. Bench results cluster near 40 A. Designers must ensure the part is not exposed to repetitive pulses that cause cumulative heating beyond thermal limits.
Thermal Rise and Derating
Expect notable temperature rise at rated currents. Practical derating rules suggest reducing continuous current to 60–80% of the rated DC current to limit core loss and ensure long-term reliability.
Practical Design and Validation Checklist
Test-Method Box: Measure L at 100 kHz with specified amplitude; measure DCR with four-wire Kelvin at 25°C; sweep DC bias for L vs. I curve; perform steady-state thermal run using thermocouples or IR after 30–60 minutes.
- Confirm L at datasheet test frequency.
- Size PCB copper for thermal mitigation.
- Validate saturation behavior with AC perturbation.
- Check for solder-joint integrity after vibration.
- Monitor efficiency delta (0.5–2%) at high load.
- Request lot sample testing for production runs.
Summary
The SRP1238A-1R0M (1.0 µH, ±20%; ~3.5 mΩ DCR) establishes realistic expectations for ripple and thermal behavior. By using the outlined measurement procedures—LCR at 100 kHz, four-wire DCR, and bias curves—designers can validate performance and apply conservative derating for continuous high-current operation.